Curling Match Prediction and Similar Positions
After creating the curling game database as detailed in my previous article, I did some additional analysis using scikit-learn and PyTorch. I first made a better prediction of who had the hammer for each end and then applied some algorithms and a neural net to predict the winner.
The original notebook and a pdf conversion are available in the Github repo.
Hammer Prediction
After creating the database in my previous article I was doing some analysis and noticed that the analysis of hammer throw wasn't aligning with expectations and statistics available from other sources. Upon further examination and spot checking a few matches from different tournaments I found that my previous method of counting the small stones in the first frame was not very accurate. The stones that it is detecting are quite small and are sometimes counted incorrectly.
My backup plan for hammer detection is somewhat more complex. The first layer of detection is checking what colour the stone is in the first position after the first throw. This can then just be inverted to know that the opposite colour has the hammer. This is complicated slightly by mixed doubles matches where there are already stones in the house but I addressed this by counting the stones. This succeeded in detecting the hammer for 68% of ends, leaving 32% unidentified.
The issue with these 32% of ends is that sometimes the first stone does not remain in the position or is not correctly detected. This then falls back on the second layer which checks the score of the previous end, the non-scoring team of course getting the hammer in the current end. This second layer brings the detection rate up to 95.68%. For the sake of fastidiousness in case the previous end was a blank I then checked back another end which brought the detection rate up to 95.72%. Another layer does not increase precision in my dataset.
I then added another item to the End records in the database to store this updated prediction. For analysis one could filter for only ends with a known hammer colour or if the accuracy is less important than number of examples then could coalesce the new prediction with the old one.
Match Result Prediction
With the better hammer colour prediction I felt better using it for some analysis. I used some scikit-learn models as well as a PyTorch model to input the ratings for each player on the team as well as who had the hammer in the first few ends to predict the winner of the match. After creating a few ensembles and tuning some hyperparameters I was able to get roughly 60% prediction rate on the match prediction. I think the low score can be put down to the inputs not having too much predictive power.
Predicting with only the player resulted in a 50% prediction, random chance, and the hammer colour information in the first few ends is mostly an identifier of who has already scored in those ends and they are clearly more likely to win.
See the semi-commented notebook linked above for the models and results.
Similar Positions
Discussing this project recently I was asked if my database could be used to provide recommendations on the 'best' next throw. I had originally written this off as too small of a database to perform this on but I figure it is worth a try. It turns out I was mostly correct but the data can provide a little insight on specific positions.
The database contains 273k positions from 18k ends and 2,100 matches. This is a considerable number of positions when just comparing stone locations for low stone count positions. However, when you consider the hammer, team colour, and throw number then there are few positions that are sufficiently similar to provide insight.
The obvious solution to find similar positions is to calculate the distance from the stones in each position to the stones in the target position. The difficulty here is that with multiple stones, you have to test the quality of fit for each permutation of position stones to target stones. This is quite a computationally heavy task so I first filter positions by the correct number of stones for each team. This still includes tens of thousands of positions for simple positions but is more effective for complex positions. The permutations are generated and vectorized and the 'score' calculated for each one. Using a simple threshold the user can specify how selective they would like to be about position similarity.
- Note that with the exception of curler handedness curling is a completely symmetrical sport so in addition to testing the regular positions I also check the position inverted along the centreline. This can be toggled.
- Also, it is possible that positions with different numbers or placement of stones are 'functionally' equivalent despite different numbers of stones. These positions are ignored for now but could be included by only considering similarity within a certain region of the ice or even just specific stones.
With the similar positions found, you can then filter by position similarity, throw type, throw number, and end result. The positions or positions that follow can be plotted to see how other playeres played the position and how the outcome.
The unfortunate part of trying to find similar positions is that curling can be extremely sensitive to stone position. A single stone shifted a few inches can change the position. When you increase the number of stones in a position above two it becomes extremely difficult to find positions that are sufficiently similar and comparisons become far less relevant. An idea to mitigate this would be to provide an interface that allows for placing stones and specifying the error for each stone individually. This would allow the user to prioritize the location of a couple stones and identify other stones as less relevant.
- As I am not particularly inspired by interfaces this will be left as an exercise for the reader...
Anyway, below is an example of its use.
The position ID and a 'score threshold' are used to parse through all of the positions and calculate the scores. I also created a quick function to plot the score distribution as seen below.
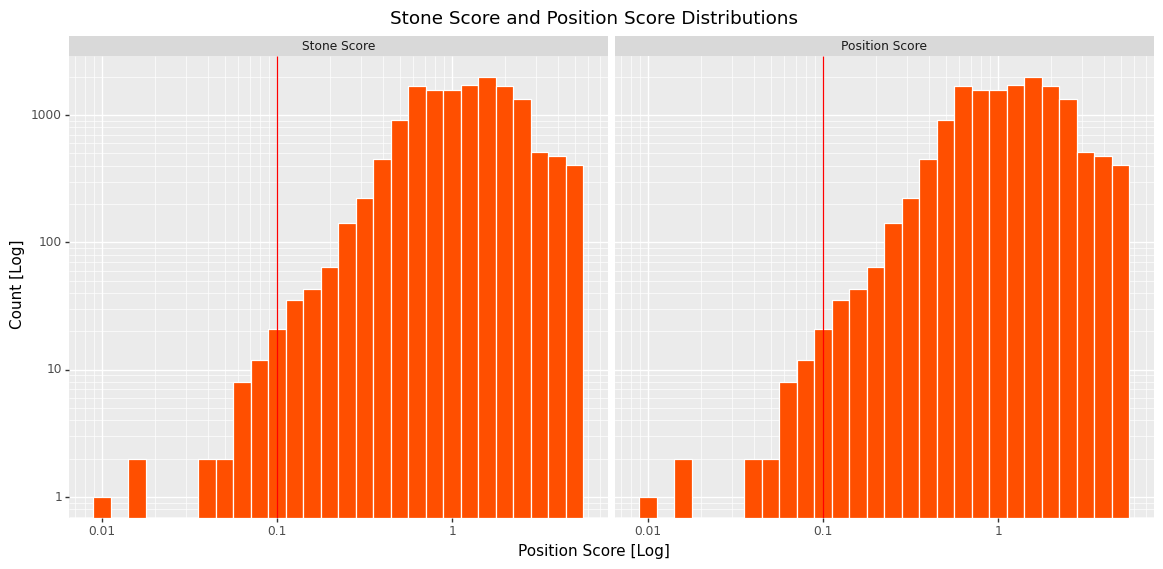
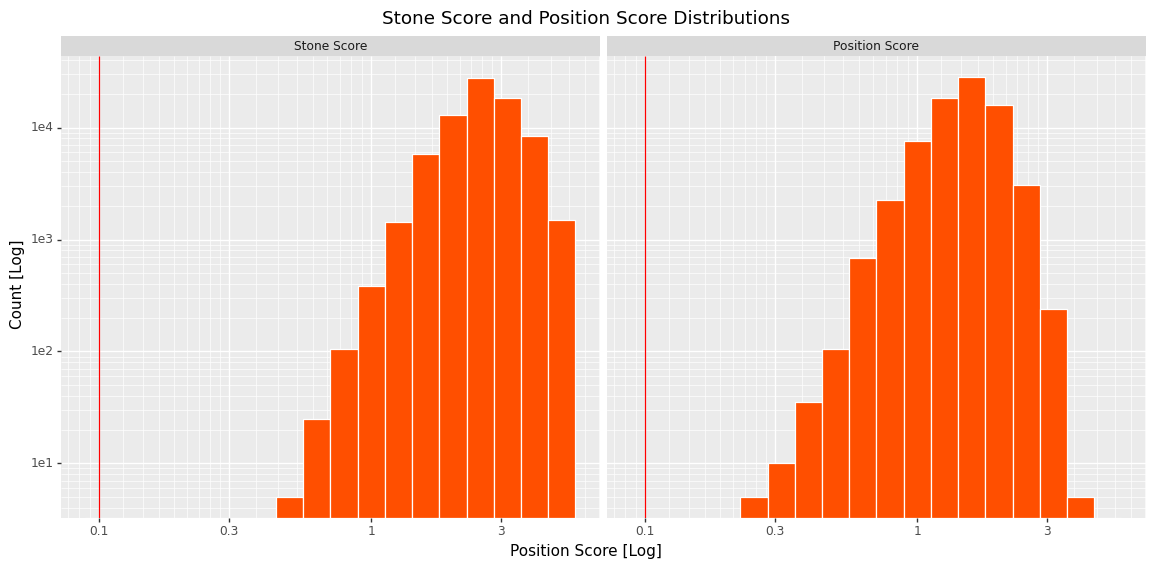
As can be seen with this very simple single stone position there are a huge number of similar positions with very low scores. For comparison, below is a plot of the score distribution for a significantly more complicated position. Note the much higher distribution and the need to increase the maximum score to retrieve a useful number of positions.
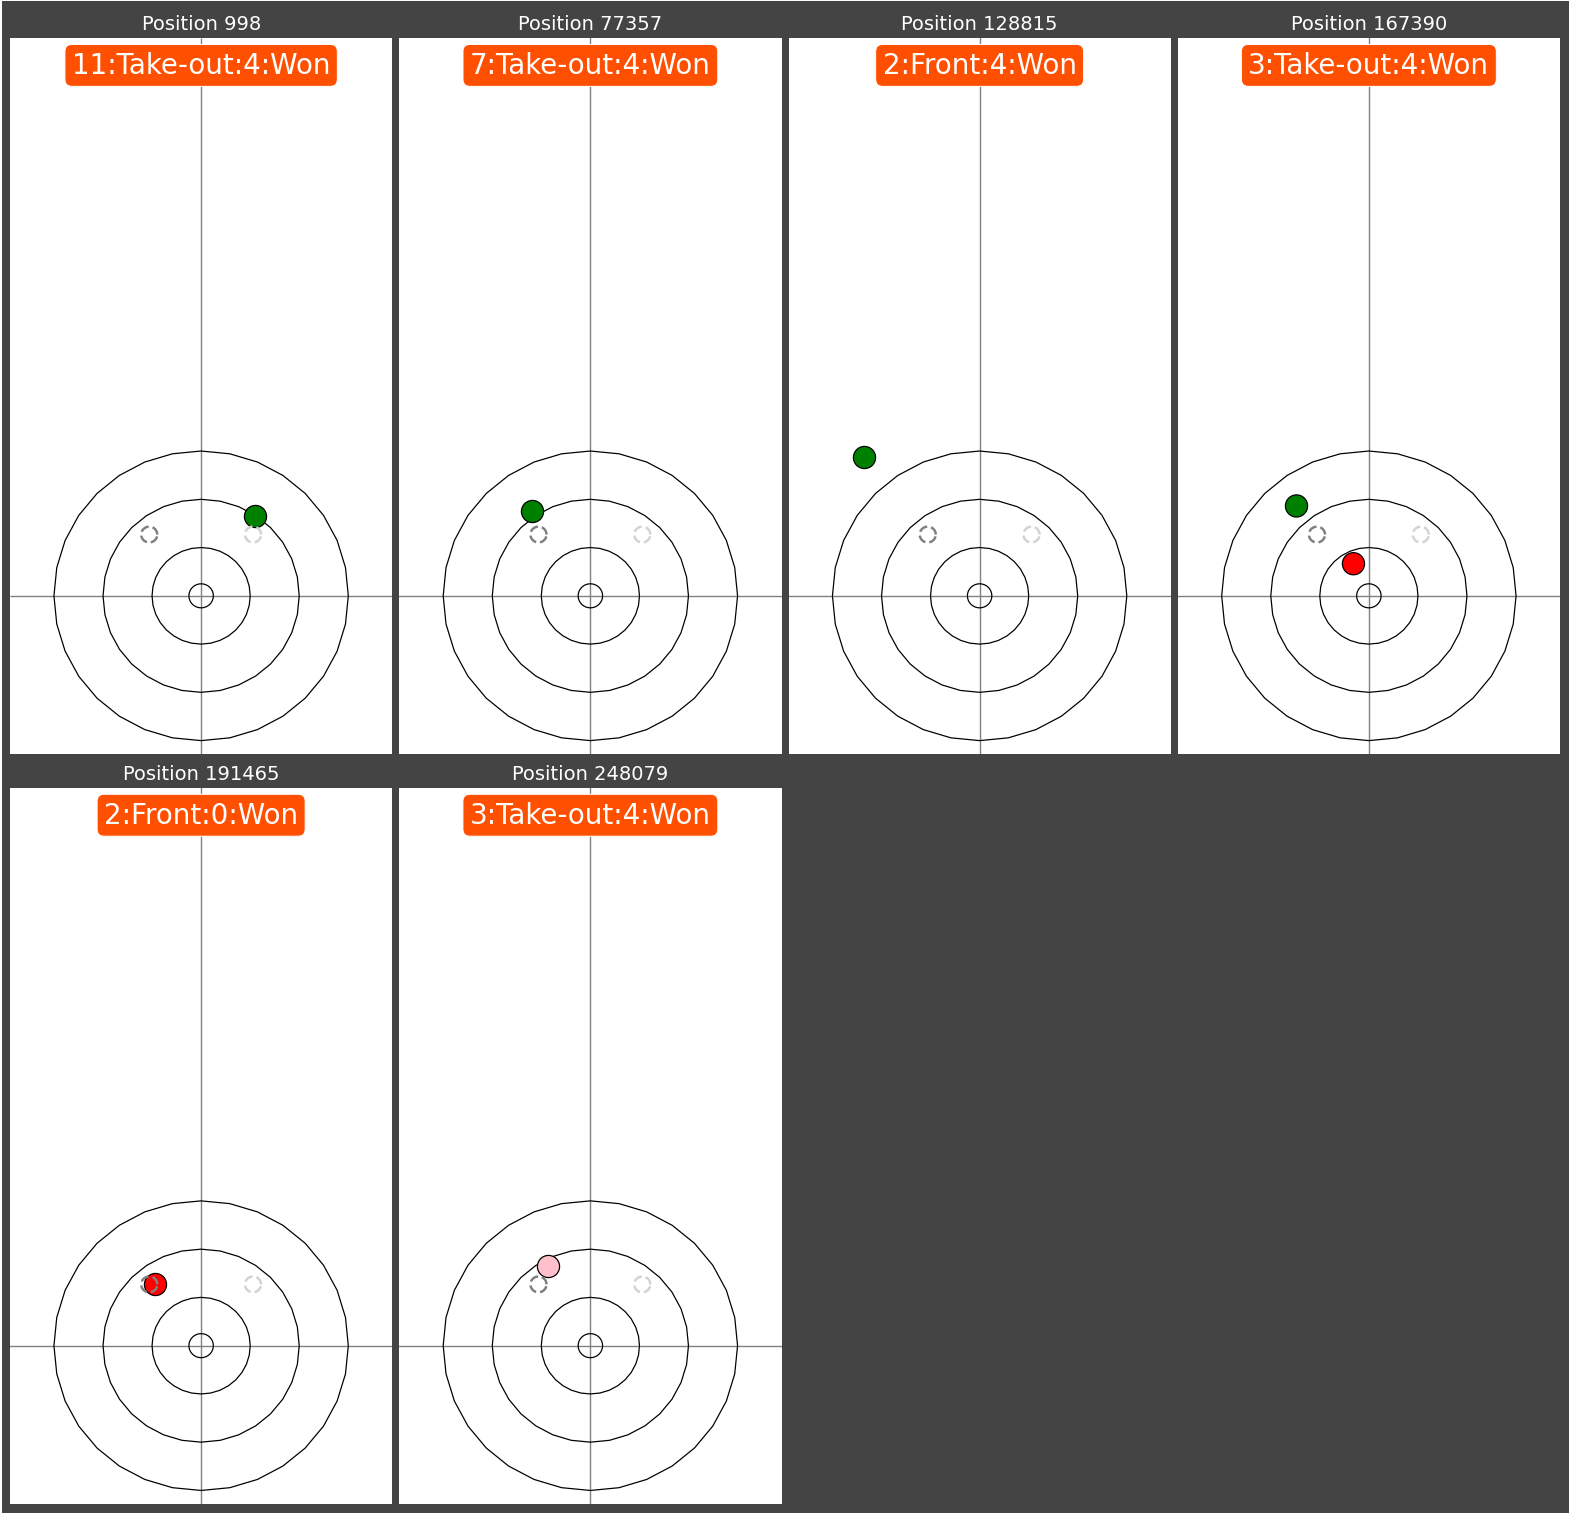
With the positions selected you can plot them all to see how similar they are and then plot all of the next positions to view the distribution of 'responses'.
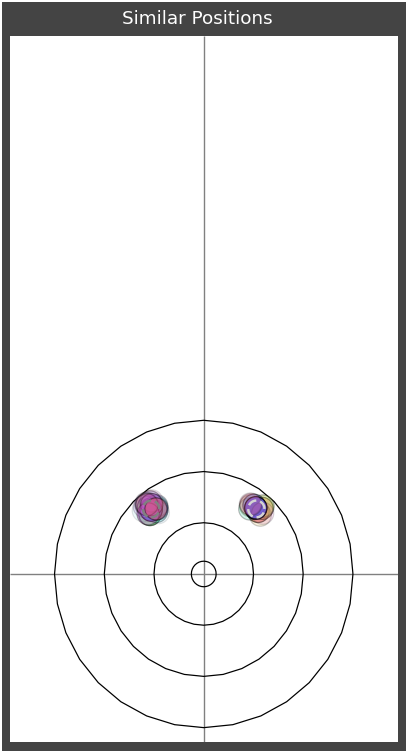
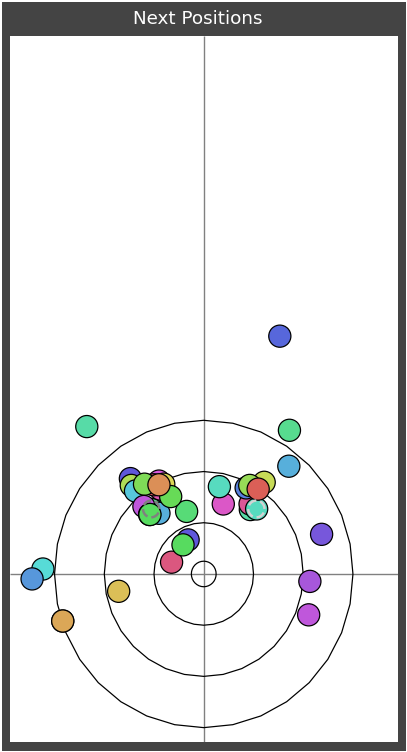
Once the selectivity has been tuned then all of the next throws and positions can be plotted in a summary to show the outcomes. The unfortunate part of this database is that it doesn't track the 'identity' of the stones between positions so it is impossible to know how each of the stones got from one position to the next. The best I can do is colour the most recently thrown stone if it is detectable in the position.
The plot below shows the positions found but additionally filtered to only throws that won their respective end. Note that the stone detection is not 100% so these positions may not be totally accurate.
In theory this could be used to study how players had played the position in previous matches and how successful each approach was. For now with the reliability of the data it is more of a curiosity and the information of the database is best used in summary statistics where the inaccuracy can be mitigated.