Curling Shot by Shot Analysis
I had previously written curling off as a boring sport but the stones aligned and it ended up piquing my interest a couple of times this year. It is still quite a slow game but this allows you to study the position and make your own 'armchair skip' calls as everybody stands around looking at the rocks. This new interest as well as the fact that it is basically a turn-based game led me to explore it with the data it generates.
I was able to find an article written by Jordan Myslik on his personal website that showed that someone else had a similar idea. I avoided fully reading the article before conducting my project but I did use his information on where to access the World Curling Federation(WCF) data as well as the idea to parse the pdf documents as xml. Reading the article afterwards it seems that our methods were very similar; likely due to there being an 'clear' way to retrieve and parse this data but there is no doubt that my work is at the very least inspired by Jordan's work.
The general process of this project is outlined below, all code is available on Github.
Rough steps of the process:
2021-01-18 Update:
The method I used to determine the hammer colour was flawed to the point of being useless
Gathering Data
Finding the Documents
The data used in Jordan Myslik's article as well as my own is data available from the World Curling Federation(WCF) via a path that can't be intentional: https://odf2.worldcurling.co/data/. None-the-less, it holds directories containing results and other data for a number(all?, most?) tournaments from 2016 to 2019. Ideally I would love to get the data up to present day but it is not available from this source.
The data of most interest is the 'Shot by Shot' documents stored deep within the nested document structure. These documents contain representations of the positions of all of the stones after each throw.(henceforth referred to as frames or positions) These shot by shot summaries are not available for every match but in the end I was able to gather 2168 of them, 2165 of them being useful.(1 corrupt, the other two forfeit matches)
Aside: It turns out that these shot by shot documents and much of the other data is generated and made available by CURLIT Curling Information Technology. They are the official results provider for olympic curling and many other top tournaments but unfortunately I have not found a way to gather the data directly from this source.(though I haven't tried particularly hard) They provide their own CURLIT Coach Tool that uses all of their own data and this is what people should actually be using if they are interested in curling analysis.
The trickiest part of retrieving this data was sifting through the documents to find the correct directory/path structure. This repository is clearly used for more than just storing these pdf documents so there are plenty of other documents to work around.
After some searching and checking to make sure that the structure is consistent I was able to find the following path structure:
/data/<event>/<match_type>/<session>/<...>Game - Shot_by_Shot<...>.pdf
where:
<event>is a unique identifier of the event/tournament<match_type>is the type of match played. One of "Men's Teams", "Women's Teams", "Mixed Teams", or "Mixed Doubles"<session>can be loosely defined as the round number or type of playoff game(semi-final, final, ...)- The Shot_by_Shot file name contains some other metadata not relevant for parsing
Within the session directories there are the summary documents that I am looking for and all contain the string "Game - Shot_by_Shot" though I narrowed it to "Shot_by_Shot" to avoid any sillyness that might arise from matching on the spaces. With this, I wrote a function to navigate this directory structure and find the paths of all files in the relevant paths matching my query. It loosely follows the pseudocode below.
for each directory in /data/
  for all sub-directories matching one of the match types(Men's Teams, ...)
    for all sub-directories
      If name contains 'Shot_by_Shot'
        Add path to list
The splitting of the searching and downloading of documents made it simpler to test as well as adding a layer of protection in case the download failed halfway through, making it simpler to pick up where it failed.
Downloading the Data
This process is quite simple as it just requires looping through the saved list of paths saved from the previous step and requesting the indicated document. I introduced a bit of a delay as to not DOS their servers and after an hour I had all of the pdfs. As previously mentioned there was a pdf document that was corrupted so I tried to go back and find the problem but it turns out that the original file is corrupted and there is nothing I can do about it so I just blacklisted it in the parsing of the documents.
for path in file:
  if file already downloaded:
    Continue
  Download file
  Save file
  sleep(delay)
Parsing the Data
An example of each page of the pdf documents can be seen below. It is comprised of 1 to 16 positions/frames along with some throw/shot information. This is topped off with the header that contains match, team, and scoring information.
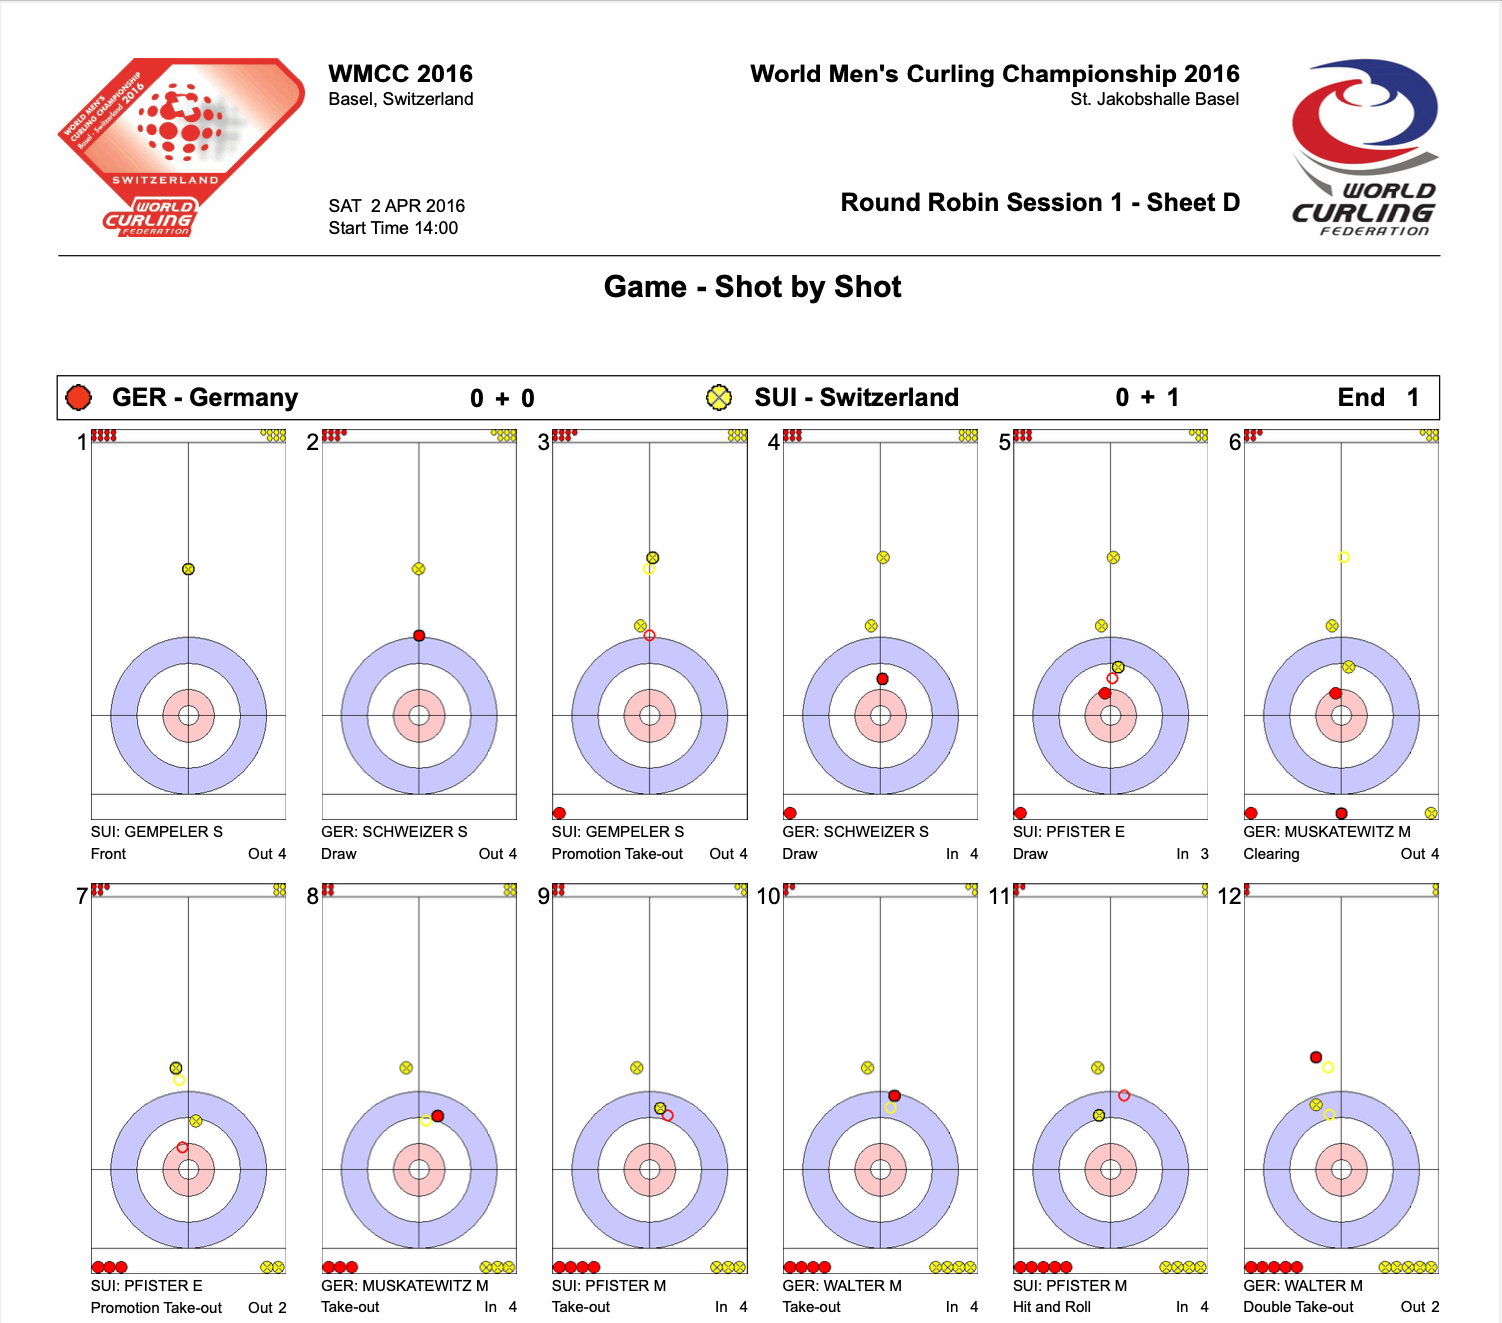
The format of the page is relatively consistent but the content in the header is regularly shuffled around and there are a few different notations used for the throw/shot information. Additionally, the direction of play switches with each end, the houses vary in colour, some frames/positions are an even number of pixels wide while others are an odd number wide, the representations of the stones vary in size, 'ghost' shells are left behind in the position where a stone has been taken out, sometimes there are 'shoot-outs' which have a completely different format, Mixed Doubles games have prepositioned stones that have to be considered, among Mixed Doubles games there are two different methods used to lay out the positions, you can't assume where the prepositioned stones are because they are occasionally offset, there is no explicit statement about who has the hammer, you cannot assume that there will be a stone in a frame/position, you cannot assume that the centre of the house won't be covered, the gender of the player is not stated in mixed matches, the score isn't always the same format and isn't always a number, and the xml generated from the pdf documents isn't always valid.
The parsing process is a nightmare and borderline not possible if not for the saving graces that the positioning of the text elements relative to eachother is fairly consistent and that the stone colours are always the same shades of red and yellow.
The parsing of the text and other elements will be explored in the following sections.
Parsing Text
The parsing of the text was the most annoying part of the whole procedure. Once I was able to get the text information out of the pdf format it was fairly smooth sailing but getting to that point was the issue. On my way to just using the same method that Jordan Myslik used, I tried to implement borb, pypdf, pdfminer and PyMuPDF. All failed to correctly parse the document or didn't provide the data to parse the information I need.
The method I settled on was using the Python os library to use the pdftohtml command line tool on each pdf document. This is by far the most reliable method that I found but it still has its problems. First of all it occasionally just outright fails to create an xml document; this was resolved by adding a single retry in the case of failure and this has been rock solid over thousands of documents. The other issue was that in certain cases the xml that it produced was invalid caused by unterminated <span> elements in the document. I resolved this by opening the xml files as text, parsing out the erroneous elements, and then proceeding to parse them as xml.
Once I had those issues sorted out, all of the text elements are parsed as elements of their respective page with attributes indicating the x and y location of the top left of the element. An excerpt can be seen below:
<page number="1" position="absolute" top="0" left="0" height="1263" width="892">
  ...
  <text top="52" left="637" width="100" height="12" font="6">St. Jakobshalle Basel</text>
  <text top="52" left="196" width="86" height="12" font="7">Basel, Switzerland</text>
  <text top="111" left="500" width="238" height="17" font="13">Round Robin Session 1 - Sheet D</text>
  <text top="35" left="446" width="291" height="17" font="19">World Men's Curling Championship 2016</text>
  <text top="160" left="359" width="177" height="20" font="23">Game - Shot by Shot</text>
  <text top="116" left="196" width="81" height="12" font="27">SAT 2 APR 2016</text>
  <text top="129" left="196" width="77" height="12" font="31">Start Time 14:00</text>
  <text top="35" left="196" width="86" height="17" font="32">WMCC 2016</text>
  <text top="227" left="795" width="49" height="17" font="33">End 1</text>
  <text top="227" left="67" width="111" height="17" font="35">GER - Germany</text>
  <text top="227" left="449" width="122" height="17" font="38">SUI - Switzerland</text>
  <text top="228" left="280" width="8" height="17" font="1">0</text>
  <text top="227" left="663" width="8" height="17" font="1">0</text>
  <text top="228" left="310" width="8" height="17" font="1">0</text>
  <text top="227" left="693" width="8" height="17" font="1">1</text>
  <text top="228" left="295" width="9" height="17" font="1">+</text>
  <text top="227" left="678" width="9" height="17" font="1">+</text>
  <text top="254" left="46" width="8" height="15" font="3">1</text>
  <text top="501" left="166" width="5" height="10" font="4">4</text>
  <text top="501" left="148" width="15" height="10" font="4">Out</text>
  <text top="501" left="54" width="21" height="10" font="39">Front</text>
  <text top="488" left="54" width="79" height="10" font="42">SUI: GEMPELER S</text>
  <text top="254" left="183" width="8" height="15" font="3">2</text>
  <text top="501" left="303" width="5" height="10" font="4">4</text>
  <text top="501" left="285" width="15" height="10" font="4">Out</text>
  <text top="501" left="191" width="21" height="10" font="43">Draw</text>
  <text top="488" left="191" width="87" height="10" font="50">GER: SCHWEIZER S</text>
  <text top="254" left="320" width="8" height="15" font="3">3</text>
  <text top="501" left="440" width="5" height="10" font="4">4</text>
  <text top="501" left="422" width="15" height="10" font="4">Out</text>
  <text top="501" left="328" width="78" height="10" font="57">Promotion Take-out</text>
  <text top="488" left="328" width="79" height="10" font="60">SUI: GEMPELER S</text>
  ...
</page>
  <page number="2" position="absolute" top="0" left="0" height="1263" width="892">
          ...
The keen-eyed reader might notice that the parsing of the text elements is not particularly intuitive and upon inspection of multiple xml files it becomes clear that the order of the elements is not a reliable method to correctly identify the desired information. The worst case of this is in the header which contains an assortment of information about the match including the event, location, date, time, and sheet identifier. Directly under the header is a section that includes the team names, current match scores, and the number of points scored in the end. Finally, the main body of the pdf is 1-16 sets of player name, throw number, throw type, throw rating, and sometimes the throw spin.
The main technique I used to parse the correct information out of the document was identifying elements with unique characteristics(position or contents), and then using them as a datum to find elements relative to their position. A summary of the identification methods is below:
- Event Name: Longest string in the header that ends with four numbers. Loose method as this is not critical or actionable information.
- Event Time: In the header region and contains the string 'Start Time'.
- Date: Identified by a fixed region.
- Team Names: Currently taken from the file name but could be taken by fixed region or beginning of player string.
- Sheet Identifier: In the header region and contains the string 'Sheet'.
- End Score: Found by region but there are two parsing cases: one case parses as a mathematical expression which can be computed using
eval(), the other requires conversion to integers before summing. These values can sometimes be alphabetic so they must be ignored as they don't provide any additional information.(Ex: 'W', 'L') - Player Name: These are the only strings in the body region that contain a semicolon.
- Throw Number: Up and to the left of each player name.
- Throw Type: Directly below each player name.
- Throw Rating: Right of the player name and either contains a '%' or is a single character[0-4].
- Throw Spin: This was ignored as it is sometime given as a word and sometimes as a symbol that would not be parsed. It isn't terribly interesting information either.
The header information is checked on every page in case there was an anomaly in conversion, it is likely that at least one of the pages was converted correctly. Each element of the xml document is checked against the above conditions and the matching information is saved into lists of tuples which are later converted into dataframes for output. In this case, they are later used as input to a SQLite database.
Parsing Positions
Beginning this project I expected this task to be the most difficult but once I found the correct method it was relatively straightforward. My first crack at identifying the locations of the circles was to use OpenCV's HoughCircles, this seems perfectly reasonable to me as 'circle' is even in the name. It took a couple of minutes to get my first 'results' but I spent hours after that trying to get it to correctly recognize circles in the colour masks that I had created. All combinations of minimum radius, maximum radius, and tuning parameters produced an image that recognized a few of the stones but would have erroneous circles scattered around the rest of the image. I attempted increasing and decreasing the image resolution as well as only parsing a single position but none of the methods provided useful results.
Luckily I was able to fall back on the ol'reliable findContours which returns a list of all sets of connected pixels in an image, known as contours. This was extremely effective as I could reliably distinguish the stones from the background(ice/house); however, this leaves the actual identification and classification of the circles up to me. I selected for only the full size stones(ignoring the small representations) by filtering on the area of the contour as well as the dimensions of the bounding box.
The small stone representations do not go unused though, their locations and count are used to identify the direction of play and which team has the hammer. This is made more complicated by the different format of Mixed Doubles matches but just requires a few extra cases.
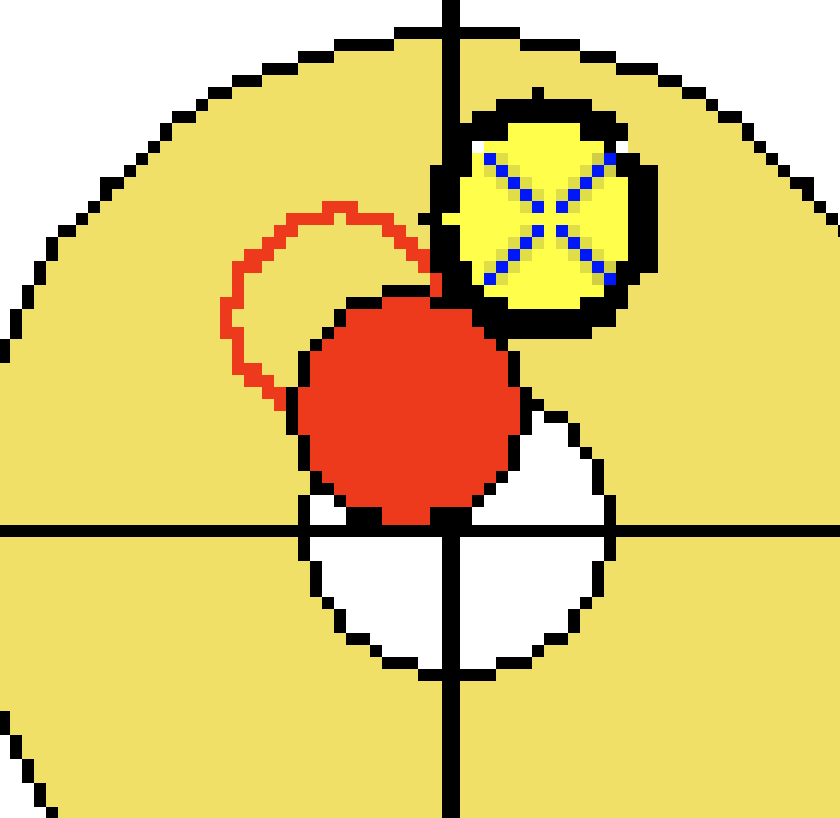
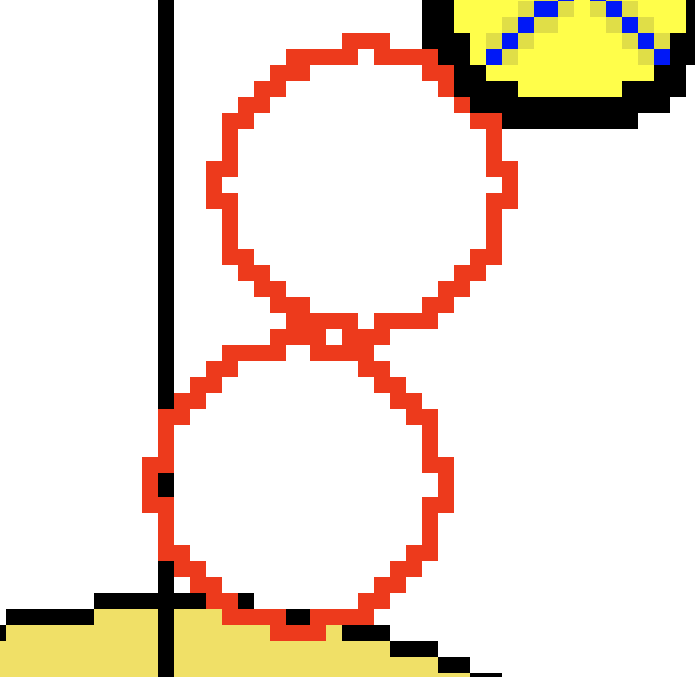
The locations of the stones are complicated by the precense of the 'ghost' stones that have been removed from the house as shown in the images below. These sometimes overlap to form strange shapes or they are interpretted as part of the same contour as a stone. In these cases I am just rejecting the contour which results in some missing stones but is likely better than having stones in incorrect or invalid positions. There is potential for using the locations of stones in the previous position to assist in identification but it becomes very difficult because the stones aren't individually identified. If I had a lot of time then I am sure I could sort something out using the previous locations, type of throw and rating of the throw to identify some of the stones.
Another interesting aspect of the position images is that the most recently thrown stone has a larger border, resulting in a slightly smaller stone fill/contour. I added the contour size information to my database in an update and can now fairly reliably distinguish the thrown stone from the stones that were already on the ice.
The individual frames are then identified by finding bounding boxes of a particular size. The exact location of the house within the frame is determined using the direction of play and the size of the frame. Then the positions of all stones in each frame are calculated relative to the centre of the house. The result of this is a list of stones along with their x and y displacement from the center of the house, their colour, and their size. This is the main output of the image parsing function.
Parsing Summary
I had a couple of small sets of pdfs that I was using for testing that only took a few minutes but to read the data from the 2165 pdfs takes roughly 4.5 hours at a rate of 8 pdf documents per minute. This does include the next step of ingesting the data into a SQLite database(2.8% of total time) but overall I am satisfied with this time. It may seem long but in theory this only has to be done once and 64% of the duration is spent converting the pdf to xml and to high resolution images. I did some testing with lower resolution conversions but it significantly impacted the accuracy and completeness of the stone detection due to the small size of the stones.
Populating SQLite Database
Schema
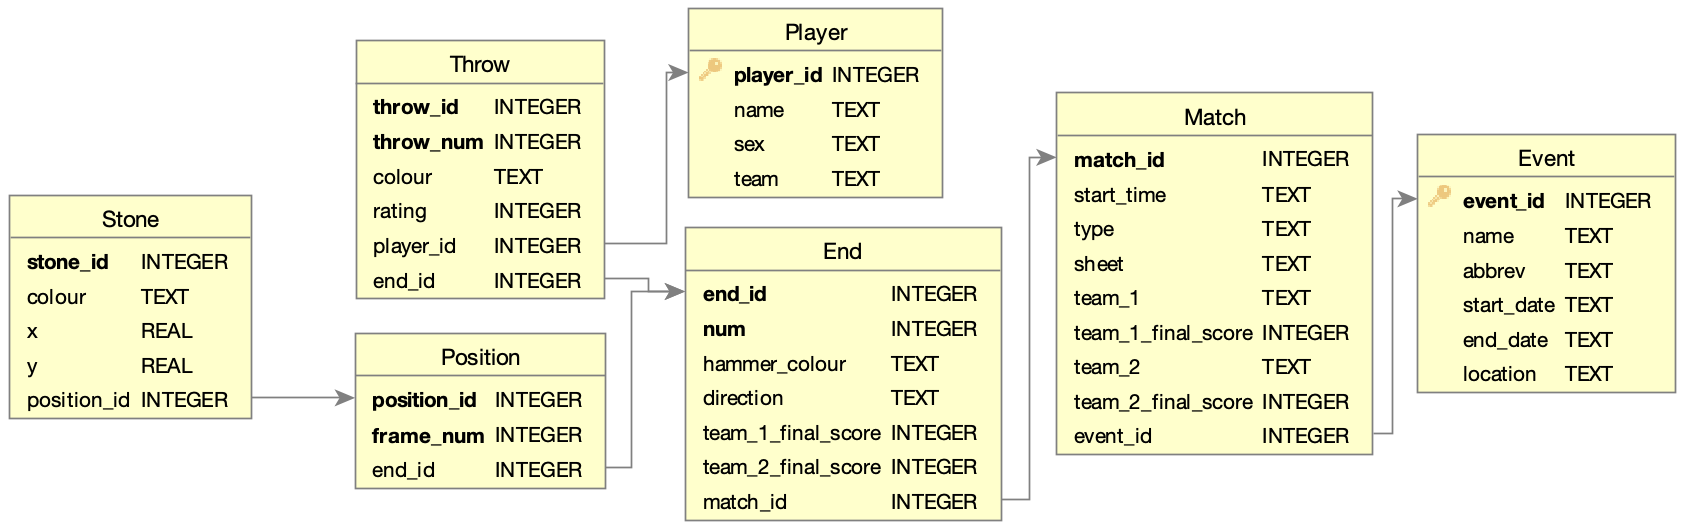
The schema I designed for this data splits the events, matches, and ends in a fairly straightforward manner. I then created a record in the throw table for each throw made in an end and a separate record for each position in the end. I first considered storing the throw and position data in a single record/table but that schema is unable to store a position that is not associated with a throw. A pre-positioned set of stones could be stored but would have null values for all of the throw data and just complicate parsing.
Populating Database
The populating of the database occurs in a similarly nested manner to the identification of the pdf documents. It takes the various dataframes and lists from the parsing stage and follows the pseudocode structure below.
for each event:
  Create event record
  for each match:
    Create match record
    for each end:
      Create end record
      for each throw:
        Create player record if required
        Create throw record
      for each position:
        Create position record
        for each stone:
          Create stone record
One slightly interesting part of this section is the creation of player records. Since the summary pdfs include Men's, Women's, and Mixed matches, it is not always guaranteed that the gender of a player can be determined. The gender of players is quite obvious when parsing a Men's or Women's match but when parsing a Mixed Doubles or Mixed Teams match there is no indication of the player's gender. Using the logic of the pseudocode below I add and update the player records as they are found. If a player is first found in a mixed game(with unknown gender) but later found in a Men's/Women's game then the record is updated with the new data.
if player exists in db:
  if (player gender is now known) and (player record has unknown gender):
    Update player record with gender
      else:
        Create player record whether gender is known or not
This system mostly ignores the complicated web that is curling teams and just sticks to nationality.
Fun with Graphs
With all of the data collected and stored in the database it is easy to query and sort data for analysis. Below are a number of plots that I have generated along with some notes. The Jupyter notebook containing all of these plots and a few extra can be found on Github.
A lot of the plots are best displayed in an extremely wide aspect ratio but my website isn't really made for this so in case they are illegibly small you can open the image in a new tab.
Heatmaps
Heatmap of Thrown Stone by Throw Number
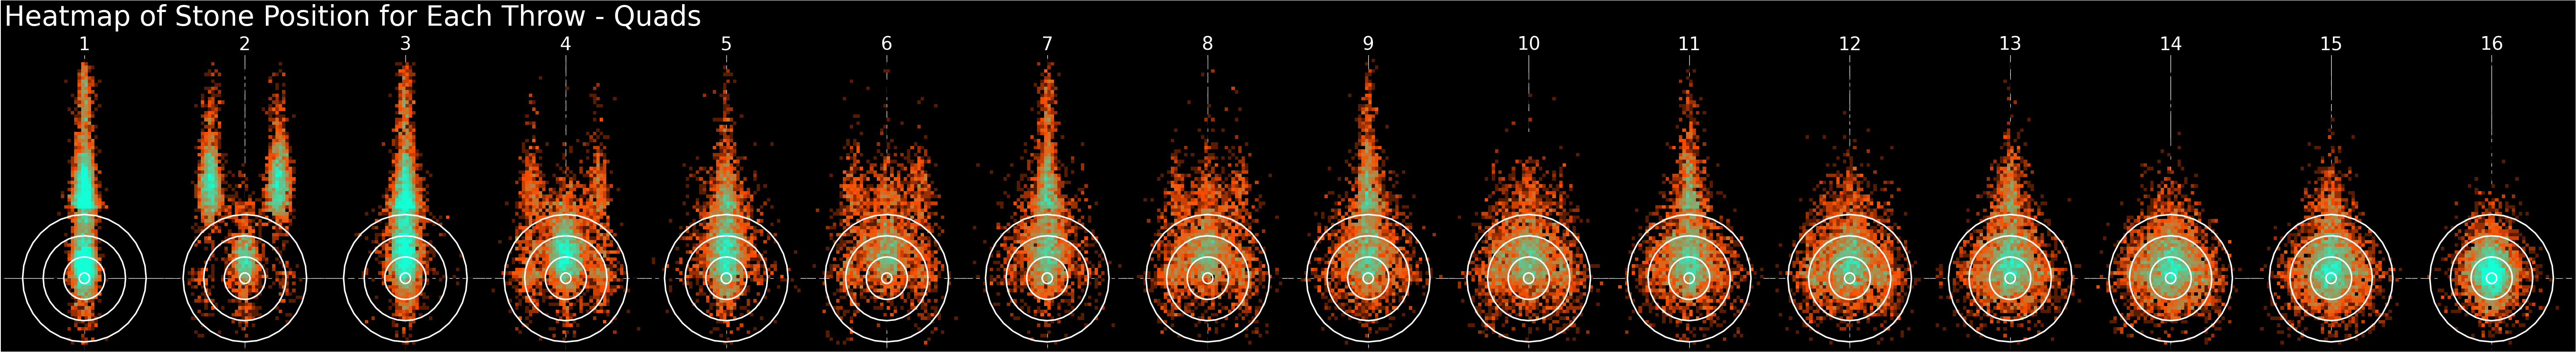
- Heatmap of the stone thrown in each position, does not display any stones already in position.(that's the next plot)
- Very interesting to see the alternating pattern between shooting a draw or center guard and shooting a corner guard for the first approximately 9 shots.
- Very interesting alternating pattern between throwing draws and center guards vs. throwing draws and corner guards.
- I have looked this up and apparently the corner guard is favoured by the team with the hammer(even throws) in an attempt to score more than one point with the hammer.
- With all of the different positions that occur, just tossing a stone in the center is always the most likely throw, with the distribution getting tighter and tighter as the end continues.
Heatmap of Stone Positions by Throw Number
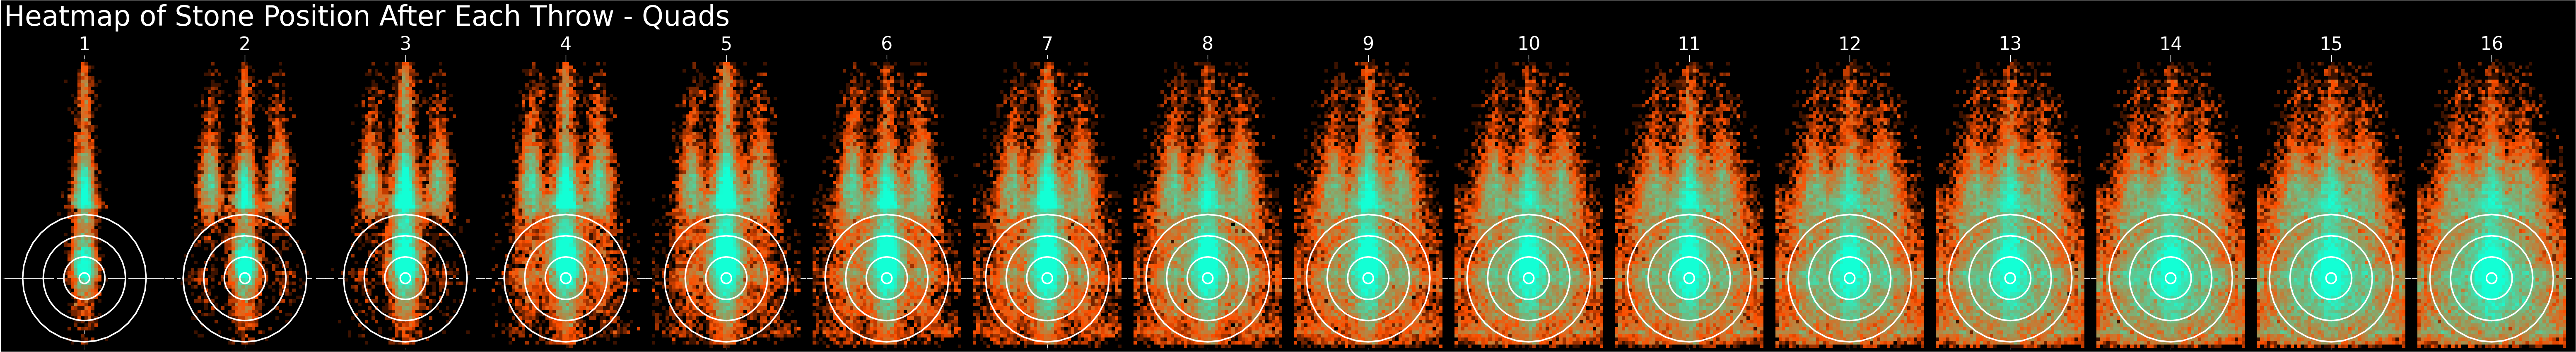
- This is a heatmap of all of the stones in a position instead of just the stone that was thrown.
- The pattern of the thrown stones can be seen here but gets diluted by the 'residual' stones as the end continues.
- A triangular pattern begins to develop 'downstream' of the corner guards as they get displaced.
- There are also significant patterns that develop from stones knocked diagonally out of the button.
Heatmap of Thrown Stone by Throw Number - Mixed Doubles
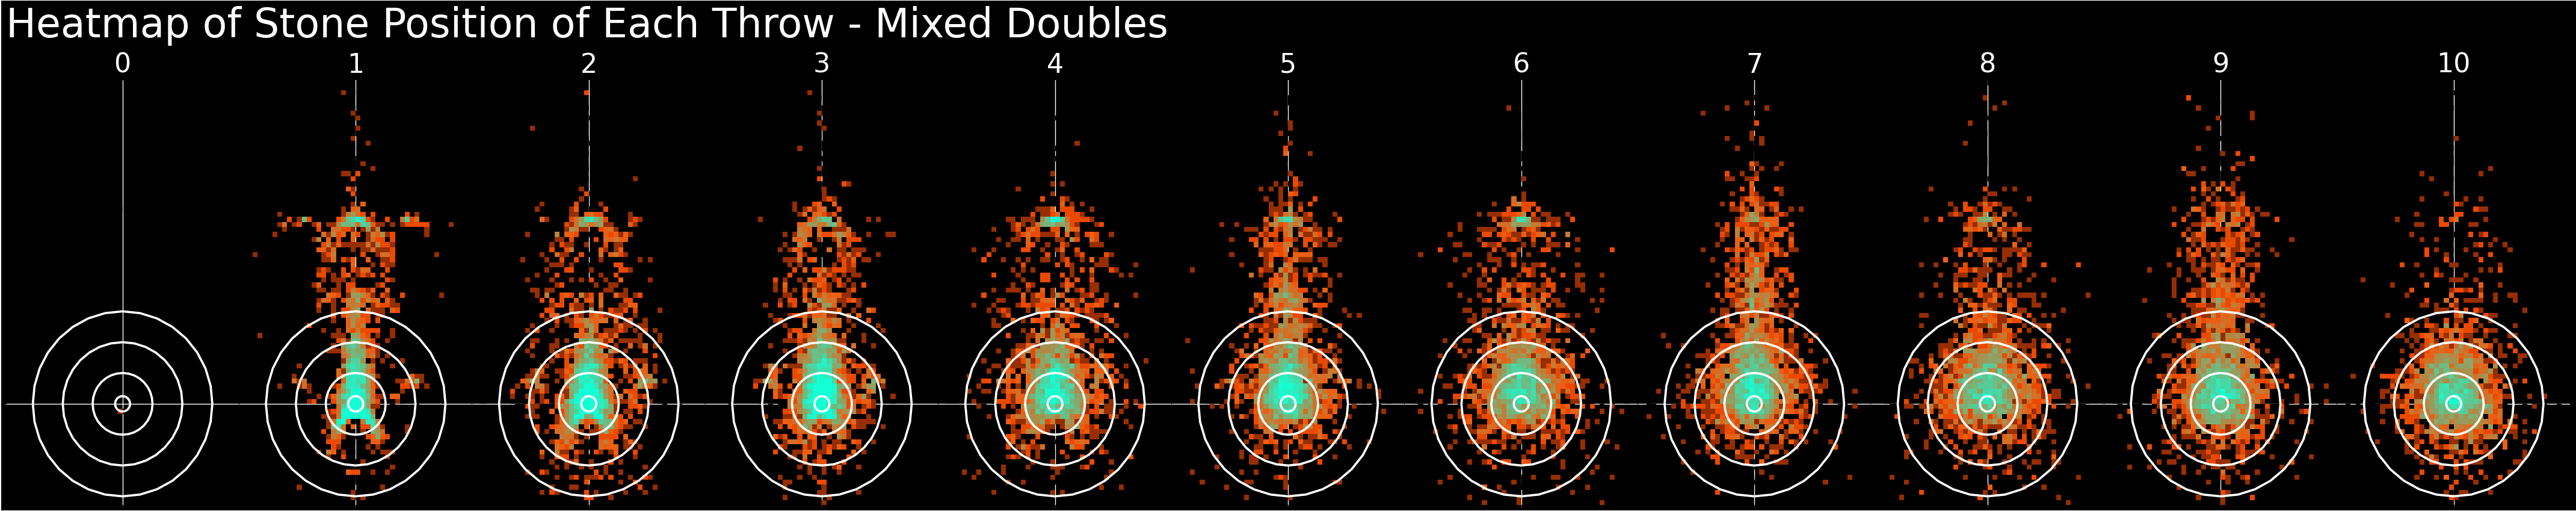
- Same method as first chart, except now there are pre-positioned stones. These are typically placed along the central axis but once a game each team can choose to use an off-axis configuration. This is more clear in the next plot.
- I find it strange that there is a far less established pattern with these positions besides just shooting for the button. There are some trails visible around the pre-positioned stone in the house but otherwise the heatmap is fairly straight-forward.
Heatmap of Stone Positions by Throw Number - Mixed Doubles
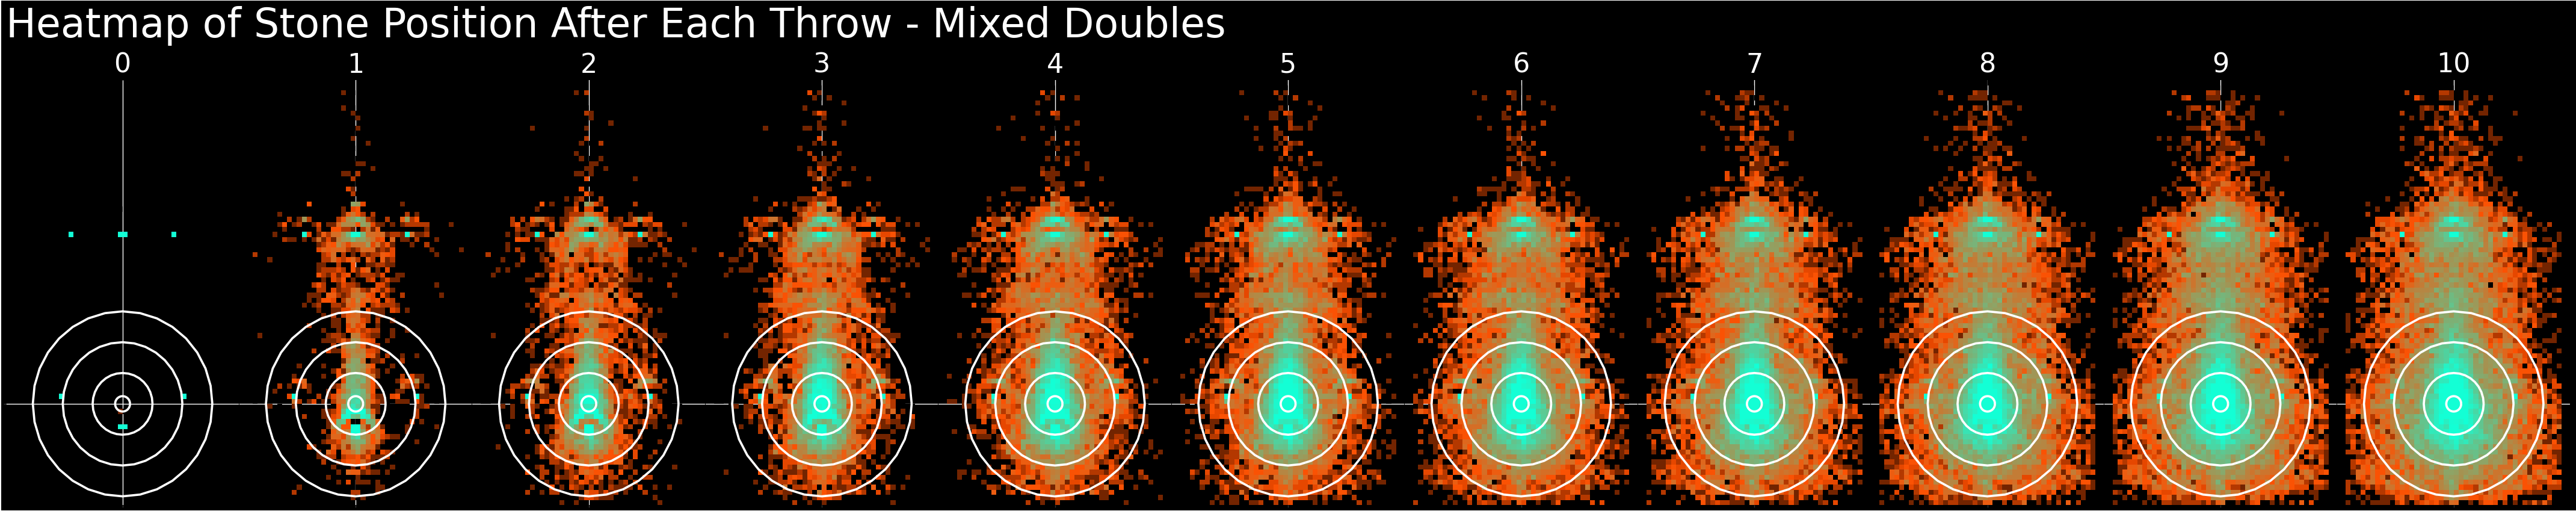
- The positions of the pre-positioned stones can be seen as bright blue points in the first frame and in a lot of cases those stones remain untouched.
- There is also a unique pattern around the center stone as it is very common to draw a stone directly into the button in front of the stone in the first few throws. The separation between the high density positions is a result of the size of the curling stones, two touching stones will have their centers approximately 28cm apart.
Throw Type Heatmap
- Heatmap of stone positions separated by the classification of the throw.
- I think my favourite one is the 'Through' type but I think the most distinct pattern is for 'Front', showing the three lanes for the common 'guards'. I believe that guards are differentiated from front stones as guards are protecting a stone that is already in the house while a front shot is proactive.
Summaries
End by End Summary
- This shows the positions of all stones thrown in a single end. There should always fewer than 17 stones in each end(11 with Mixed Doubles), however, it is highly likly that it is lower due to Through shots or other shots that result in the thrown stone being removed from the ice.
- This particular game (NZL vs. AUS) shows a few good examples of different types of ends. The 7th and 8th are notable as all of the stones are located in the house in contrast to the other games which use a number of guards. This represents an end where the number of stones on the ice remains low for the majority of the ground and most of the shots are draws or take-outs.
- It is mostly interesting to see how activity becomes focused on a particular region of the ice. While this is often a center guard or the button, it also occurs in other locations.
Match Summary

- This plot is mostly a curiosity but could be interesting to make as a poster of some sort to be able to sumarize an entire match. The blue stones represent a stone just thrown by red and the green stones are stones just thrown by yellow.
- Being most familiar with chess where the first 10-20 moves of a game have been seen before the thing I find most interesting here is the variation in the first and second shots of the match. Though something that must be considered is that the state of the game is not identical at the beginning of each end as a team may be behind and trying to score more points, ahead and trying to minimize points, trying to keep the hammer, or some other tactic I don't know about.
Stone Location by Throw Class

- This is just a plot for fun that shows all of the stones thrown by a player(that I have access to), coloured by a loosely defined throw type and sized by the accuracy rating.
- Not much to say and not very informative.
Throw Ratings
Rating by Shot Type

- The average rating of each shot for all players, and its distribution. Some shots have not been made by all players so they have fewer ratings.
- This is a crude way of displaying the relative difficulty of each type of shot. It must also be considered that some shots are more strictly rated than others though this also correlates with difficulty so I don't think it has much of an effect. Also more complicated shots will likely only be played by more skilled players so their ratings are artificially higher than if all players attempted those shots.
Rating by Shot Class

- This is identical to the above chart except the shots are now divided by a loose definition of the 'class' of the shot.
- As I would expect, guards and front shots are relatively simpler and have a higher average rating while draws and the specialy miscelaneous shots have a lower rating.
Average Rating by Throw Number
- This is a plot that I thought would be more interesting when I thought that there would be a more prescribed throw pattern to the game but after viewing the heatmaps it is clear that the chaos of the positions largely overpowers most patterns with the exception of the odd throws having a higher proportion of guards/takeouts and raising their rating.
- It is pretty clear that the high accuracy of the first few throws is a result of the small number of stones in the position and relative simplicity of the shot. This is backed up by the next plot.
Average Rating by Stone Count

- The average rating of throws with respect to the number of stones already in the position. Note that the sample size decreases dramatically as the number of stones approaches the number of throws.
- Predictably the accuracy drops as the number of stones increases. Likely due to the complexity of the position requiring more complicated throws as well as making it difficult to shoot typically simple shots.
Percentage of Throw Type by Throw Number

- The percentage of throws of each type by throw number, showing the likelihood of a type of throw as an end progresses.
- The use of prepositioned stones in the Mixed Doubles matches leads to a much higher percentage of draws. This is also affected by the modified free guard rule.
- This also shows the alternating pattern of draws and guards/take-outs in the full length games.
- There is a significant spike of clearing shots with the hammer throw, I suspect this is a typical pattern of gaining points by removal of an opponent's closer stone.
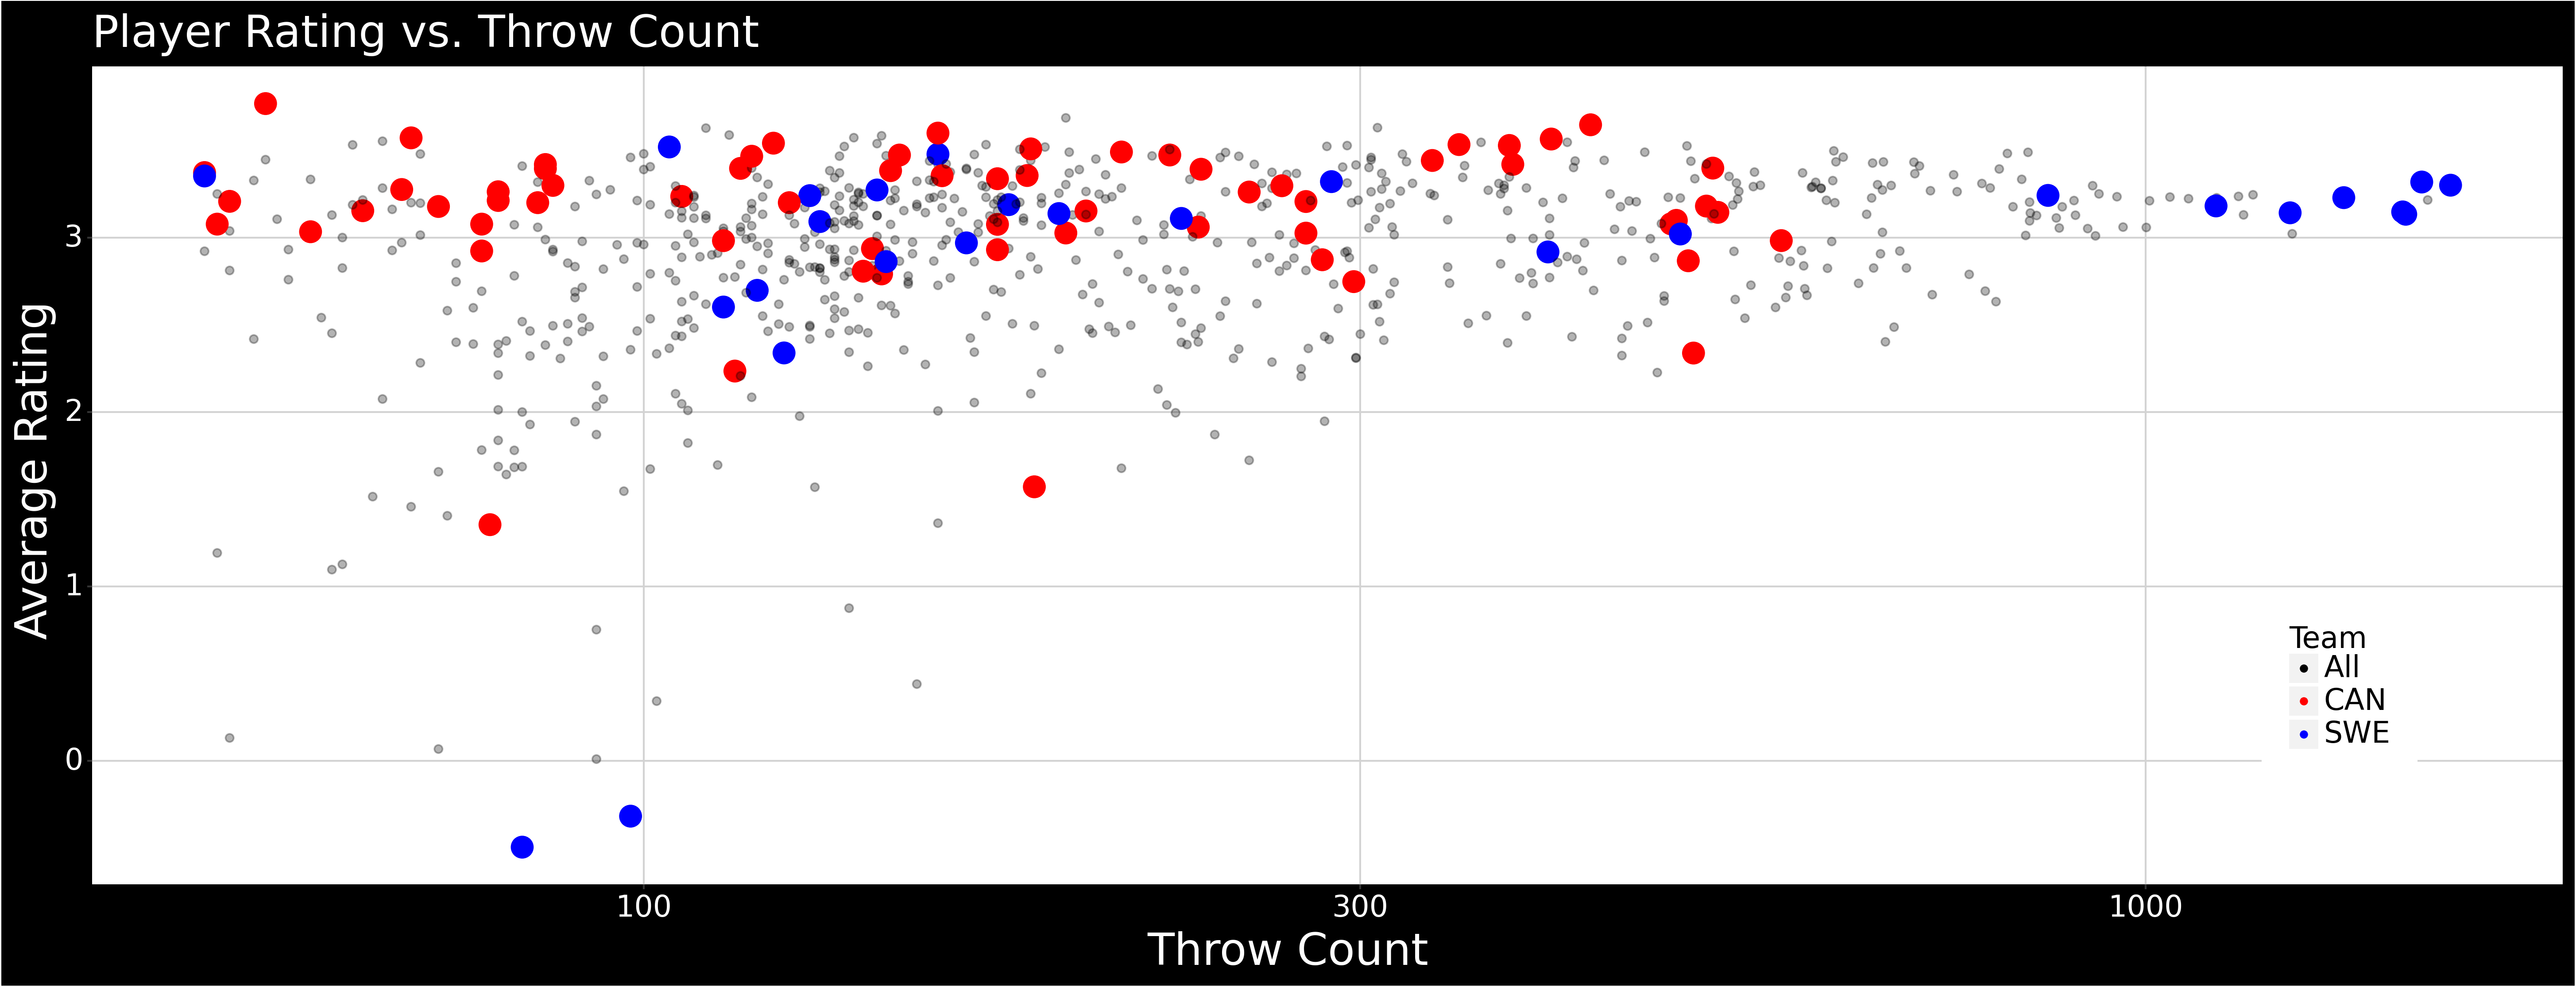
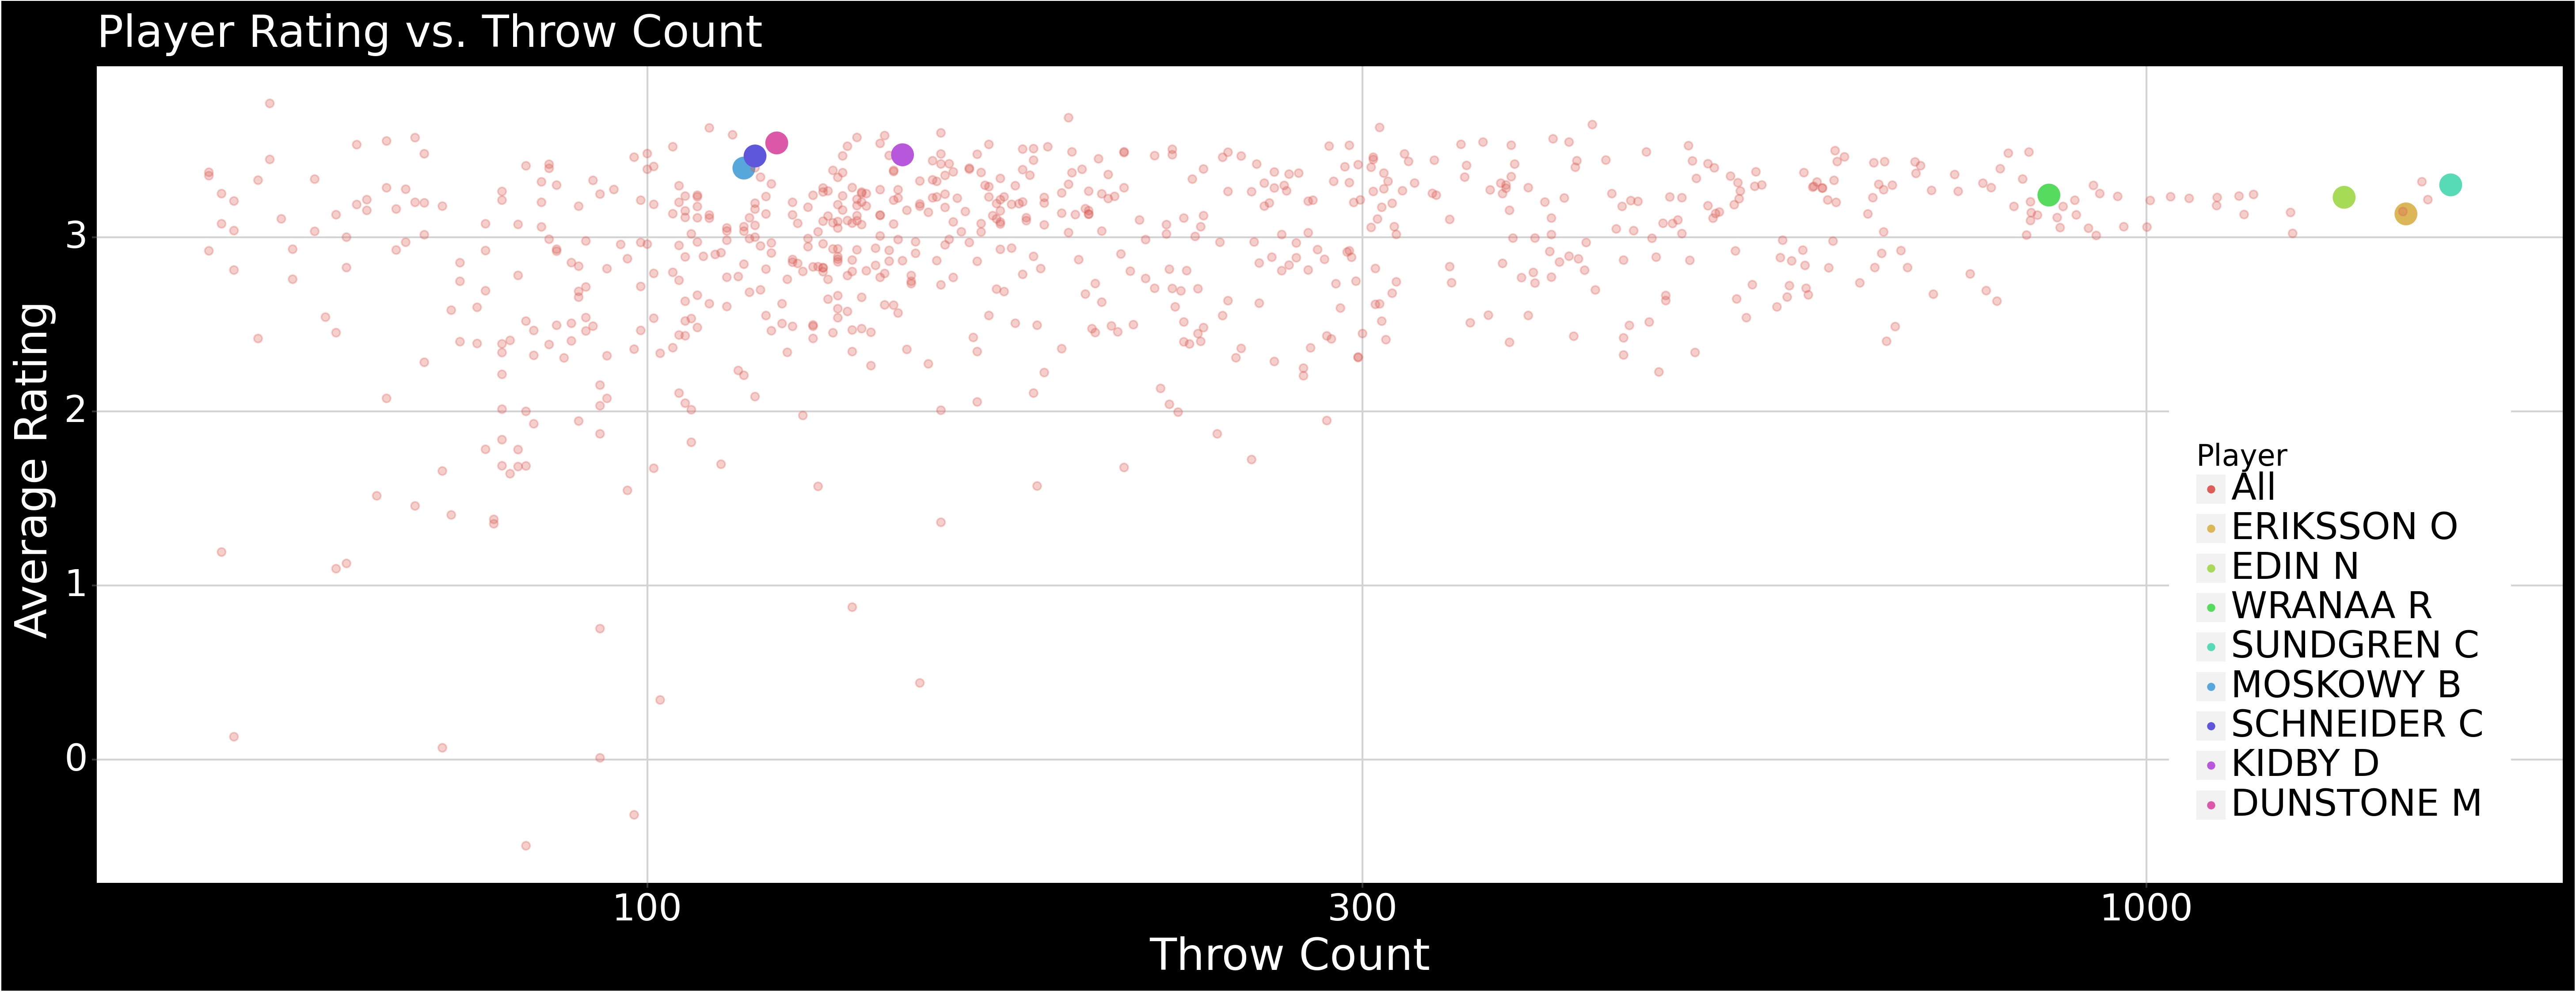
Player Rating vs. Throw Count
Assorted plots. If this held more useful and up-to-date information then I might be bothered to create some sort of interactive app/plot to highlight players/teams.
Scores
Team Match Score Difference
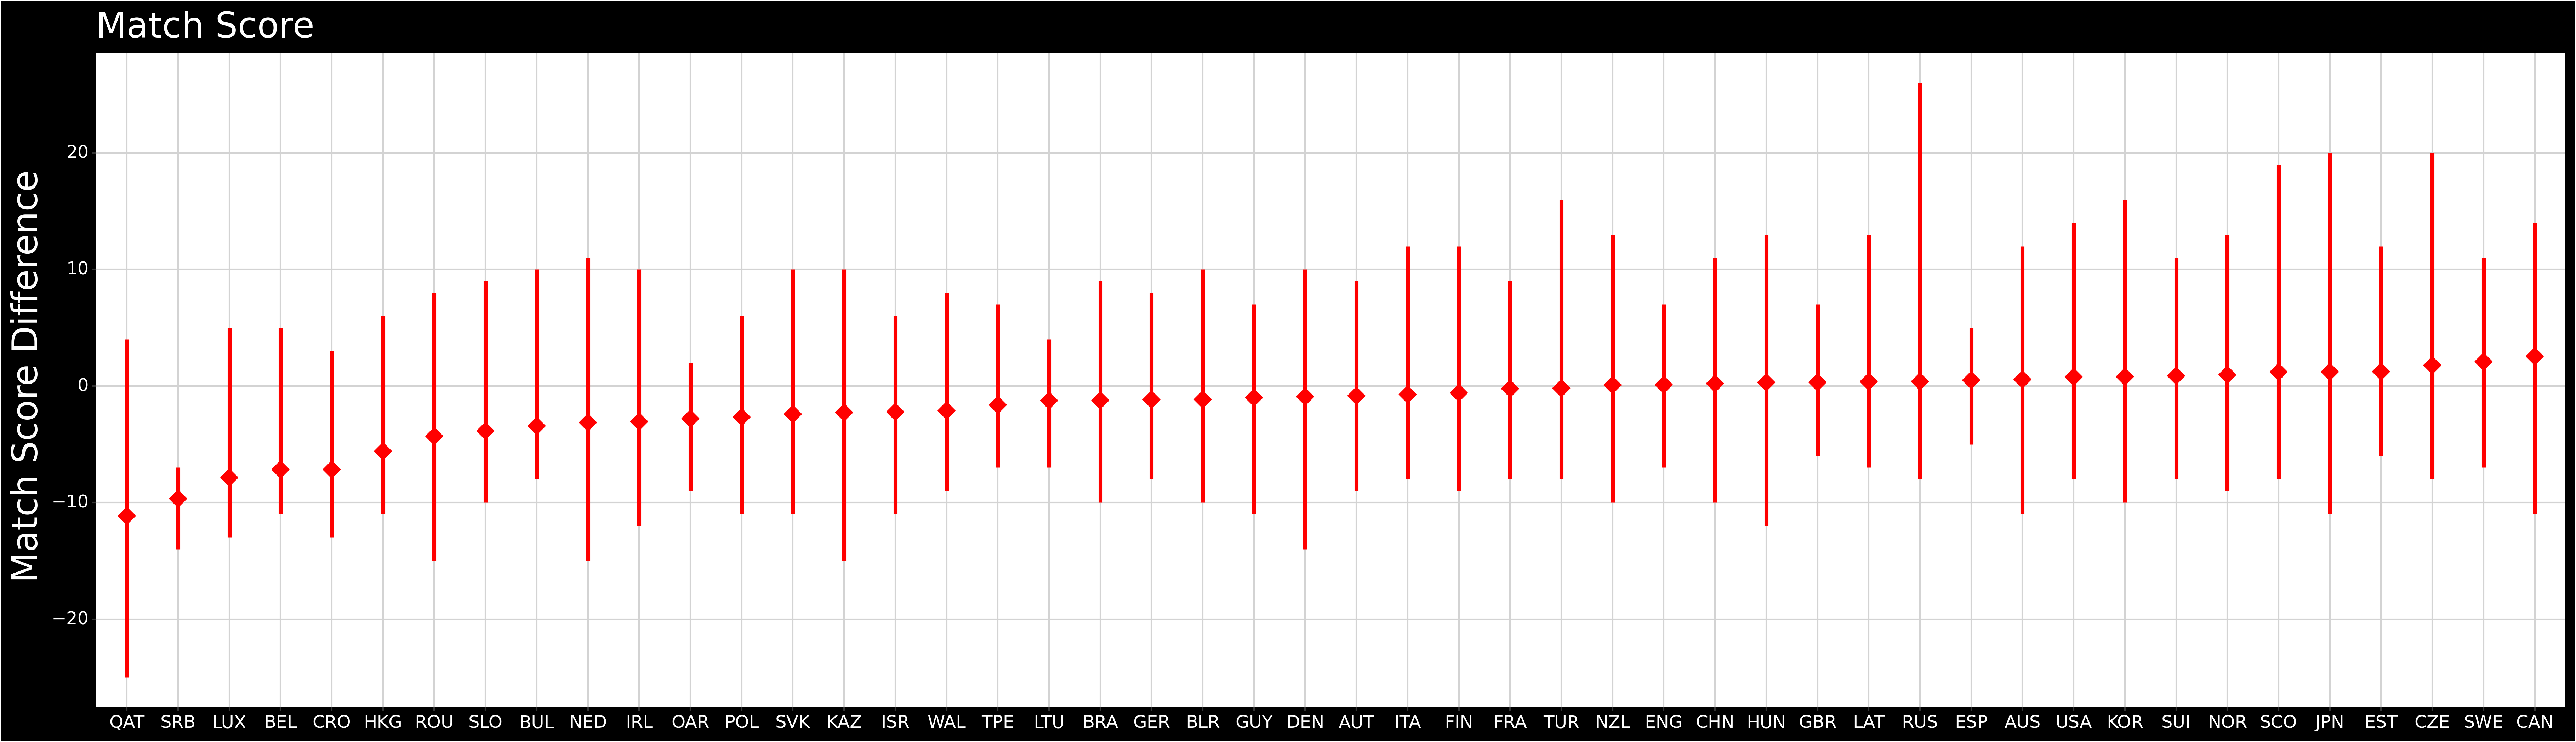
- The average as well as upper and lower limits of match score difference for each nation with at least 5 matches.
- Russia had a particularly successful 26-0 game against Qatar.
- All countries right of France have a positive average match score difference.
- Canada is clearly the best.
Team End Scores
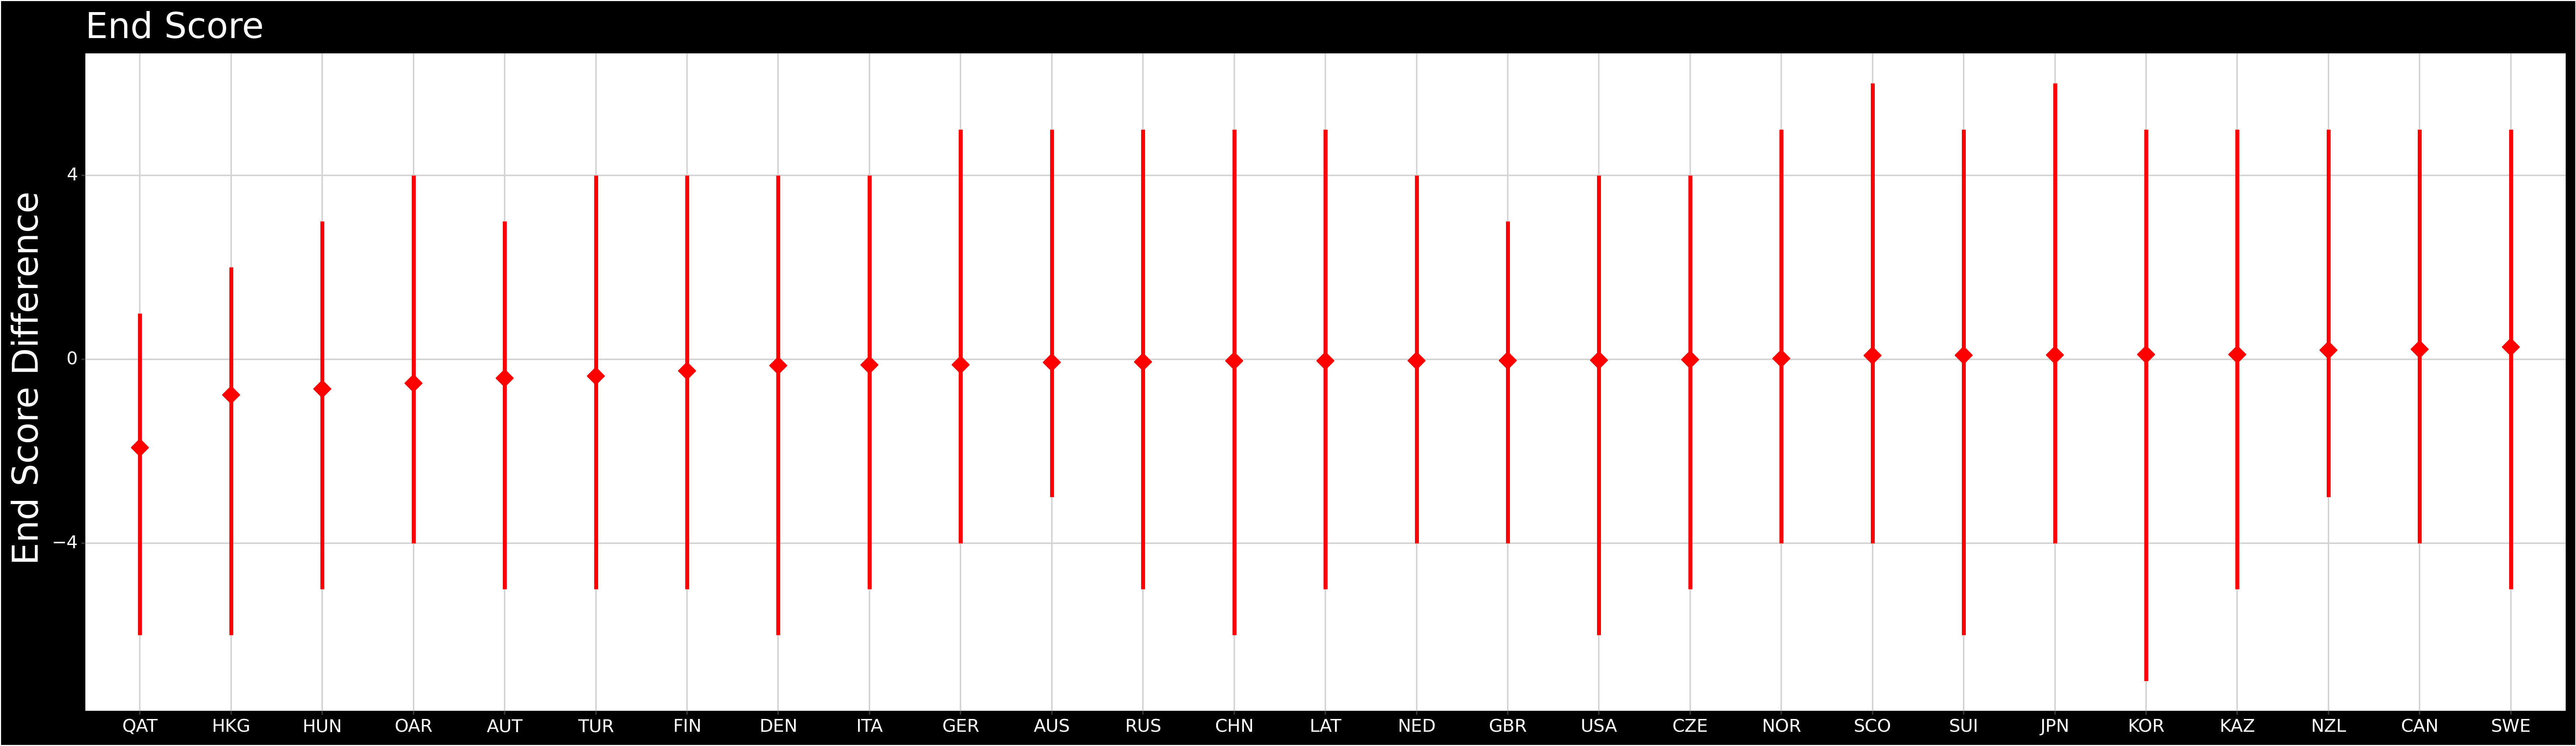
- The average as well as upper and lower limits of end score difference for each nation with at least 40 ends.
- After some playing around with geodata there doesn't seem to be any significant correlation with latitude(r=0.053, p=.750) as some suppose, there is actually a higher correlation with longitude(r=0.142, p=.389).
- Canada stays winning.