Chess Plotter
"The ability to play chess is the sign of a gentleman. The ability to play chess well is the sign of a wasted life."
I am one of the many that discovered/rediscovered chess in the middle of the pandemic and I was immediately hooked. I knew the rules and had played recreationally but I had never put effort into playing the game or playing it well. Once I paid a bit more attention I spent hours a day watching chess, playing puzzles, and studying openings.
I don't think I can fully explain my addiction but there is something about the idea that you and your opponent are playing the same board and advantage is only gained by your own talent. There is no secrets or luck that can lead to an undeserved win. The unfortunate inverse to this is that every mistake is also entirely your fault.
I'll never be good enough at chess to have wasted my life but I do strive to do my best and that involves using a suite of techniques and tools. These are mostly built around openings or the endgame where there are a more limited number of positions. However, I found that I had questions about my games that weren't being answered. The insights that I am looking for likely aren't that helpful for improving my game but satisfy some curiosities about my playstyle.
The Application
So I created some plots with data from Chess.com but it was annoying to keep running the script so I wrapped it in a GUI for simpler data filtering and plotting. The main view of the app is as below:
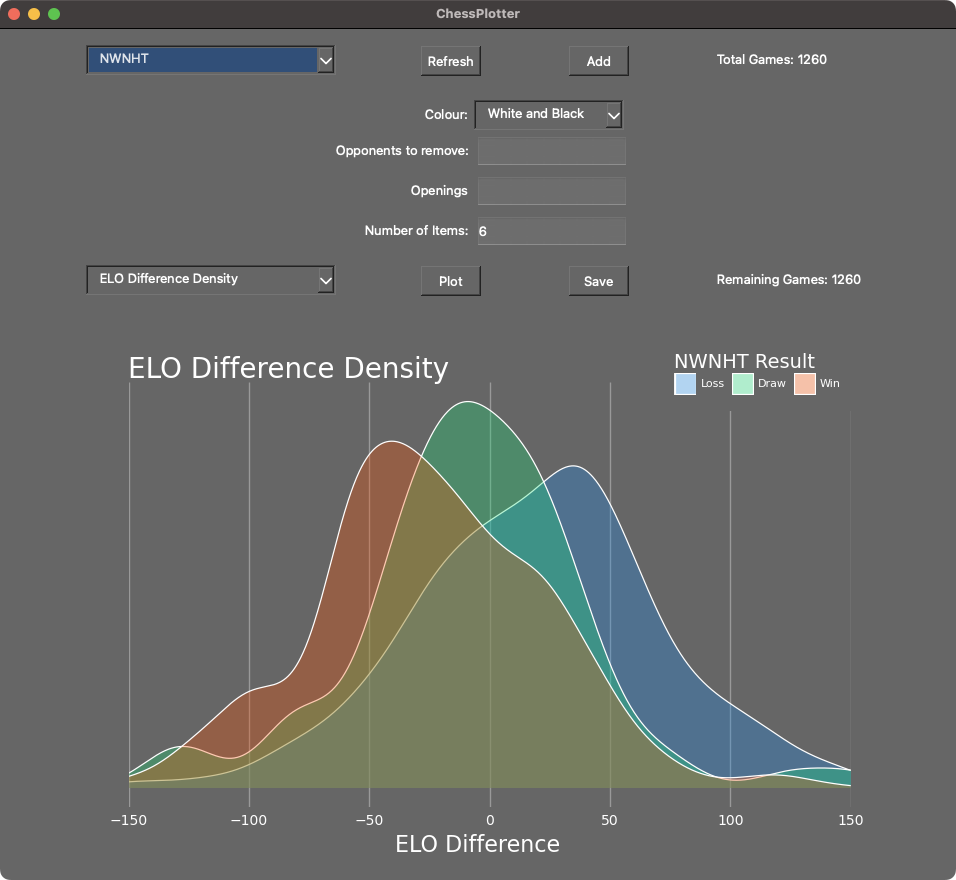
The basic operation is to select a user from the top dropdown, apply any player or game filters, select the plot from the bottom dropdown, and then click the plot button to display it. Further details on operation can be found in the Github repository along with installation instructions for the app.
Retrieving Data / Chess.com API
All of the online chess that I have played has been on Chess.com, which provides some nice features for learning as well as a reasonable if not slightly convoluted API for accessing public data. All games can be accessed but must be done by requesting archives of individual months. I can see some reasoning for this if this is already how Chess.com is storing this data but it would be great to be able to request a single game, a date range of games, or anything in between.
Additionally, there is no rate limit on the API, they allow infinite sequential requests. However, if you are making parallel requests they will arbitrarily just not serve the data and send you an error. This is alright for simple requests but when retrieving all of the games for a player it is annoying to hit this invisible threshold and have to redo the request. I far prefer a standard fixed rate limit or at least something well defined.
To interact with Chess.com's API I did find and use a Python package cleverly named chess.com. It provides synchronous and asynchronous functions for making requests to each of the available endpoints. It has worked very consistently and I will continue to use it and highly recommend it to anyone else accessing this data. It even provides some functionality to space out parallel requests to mitigate the chances of a denied request but this hasn't been 100% effective for me, though this is likely due to me improperly setting the parameters governing repeated requests.
Data
The game data returned by the Chess.com API is formatted in Portable Game Notation(PGN) which is the standard for chess games. It takes the form of a header consisting of tags(7 required and any more are optional) followed by the movetext, a numbered list of moves in Standard Algebraic Notation(SAN). The movetext can also contain comments, glyphs, clock values and evaluations if certain extensions of the standard are implemented.
An example pgn can be seen below:
[Event "Example Tournament"]
[Site "Example Location"]
[Date "2022-11-13"]
[Round "1"]
[White "NWNHT"]
[Black "BCiks"]
[Result "1-0"]

1. e4 e5 2. Bc4 Nc6 3. Qh5 Nf6 4. Qxf7# 1-0
There is a great Python package python-chess for reading and interpreting PGNs as well as turning the entire game into a tree structure of moves and positions. I have used it for some testing but it was not required for the data processing I did for this project.
Instead I split the pgn files into individual games and applied regular expressions to retrieve the tags and individual moves along with any of the extended movetext clock formatting.
tags = re.compile(r'\[(.*?) \"(.*?)\"\]')
moves = re.compile(r'([0-9]*[.]+) ([a-zA-Z0-9+#=/]*) \{\[%clk ([0-9:.]*)\]\}')
I turn the tags into a dictionary and add another another key-value pair for the list of moves.
Processing Data
Each of the dictionaries describing a single game are then compiled into a pandas dataframe for each user that was requested. This is a lot of useful and actionable data on its own but I also cleaned some dates and missing values before adding a few columns to tag the games based on the player of interest and result. This isn't a brilliant data scheme but it works with minimal extra effort so it is perfect for this precise situation. See the addendum for a more robust scheme.
The dataframes are then saved to parquet files for some basic caching. These are just re-processed and overwritten each time new data is retrieved.
Plots
The plots are the main show of the application and are generated using my favourite plotting package plotnine, a Python clone of ggplot2. It uses a grammar of graphing to create the plots which I find very intuitive; I explain it further in my Strava article.
I created a separate plotting class ChessPlots with a method for each type of plot. Each call of the object must pass all of the data and filtering information from the application so it is available for the plot if required. The plot is generated and sent to the GUI with the option to save the plot as a png. Additional plot types can be added simply by adding another method to the class and updating the dictionary of name-method pairs.
Examples of all of the plots can be seen in the Github repository.
GUI
I don't find designing or creating graphical user interfaces(GUIs) particularly interesting but it is a lot simpler to use a GUI to generate these plots than fiddle around with the command line for each graphic. To solve the GUI problem I used PyQT which turned out to be quite seamless to work with and doesn't look too bad right out of the box.
My application isn't overly complicated but it has a few elements in a couple windows and it was relatively painless to build. I didn't invest a lot of time into the intricacies of the package but one feature I did notice was the ability to use plain CSS for styling so you don't have to learn some other proprietary styling method.
That is really all I have to say about the GUI, it serves it's function and doesn't look awful, that's a win for me. I'm more interested in making the plots look pretty.
Analysis
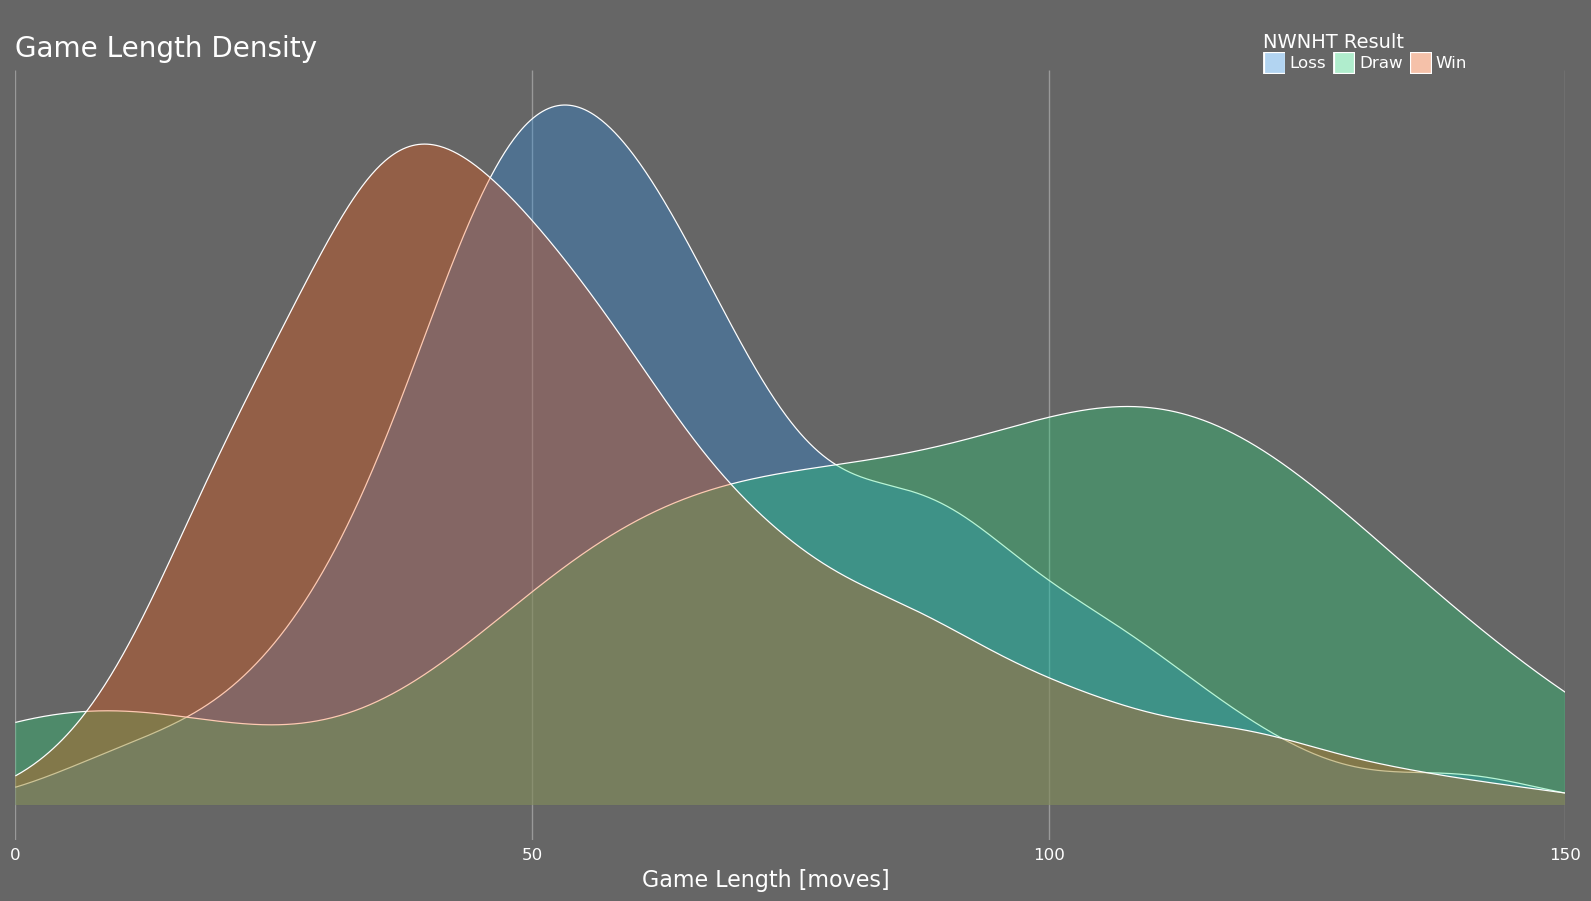
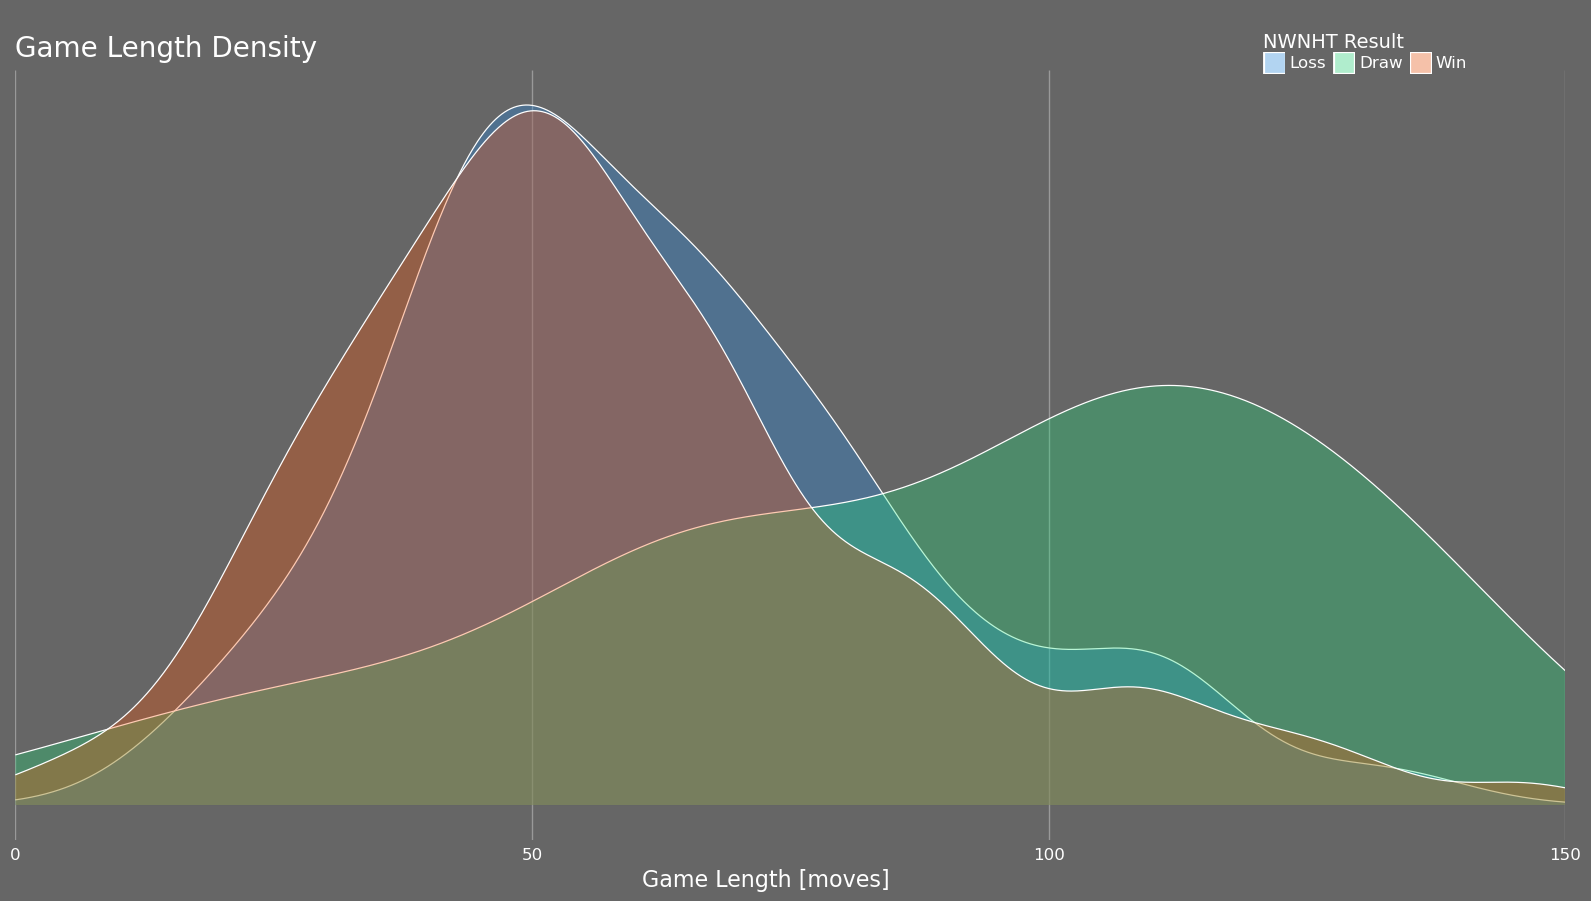
Game Length Density
One of the my favourite plots generated by this tool is the game length density plot which plots the density of game lengths grouped by game result. It isn't particularly granular but there are unique insights to be drawn. Shown below is my game length density plot along with the game length density plot of my friend who also got into chess.
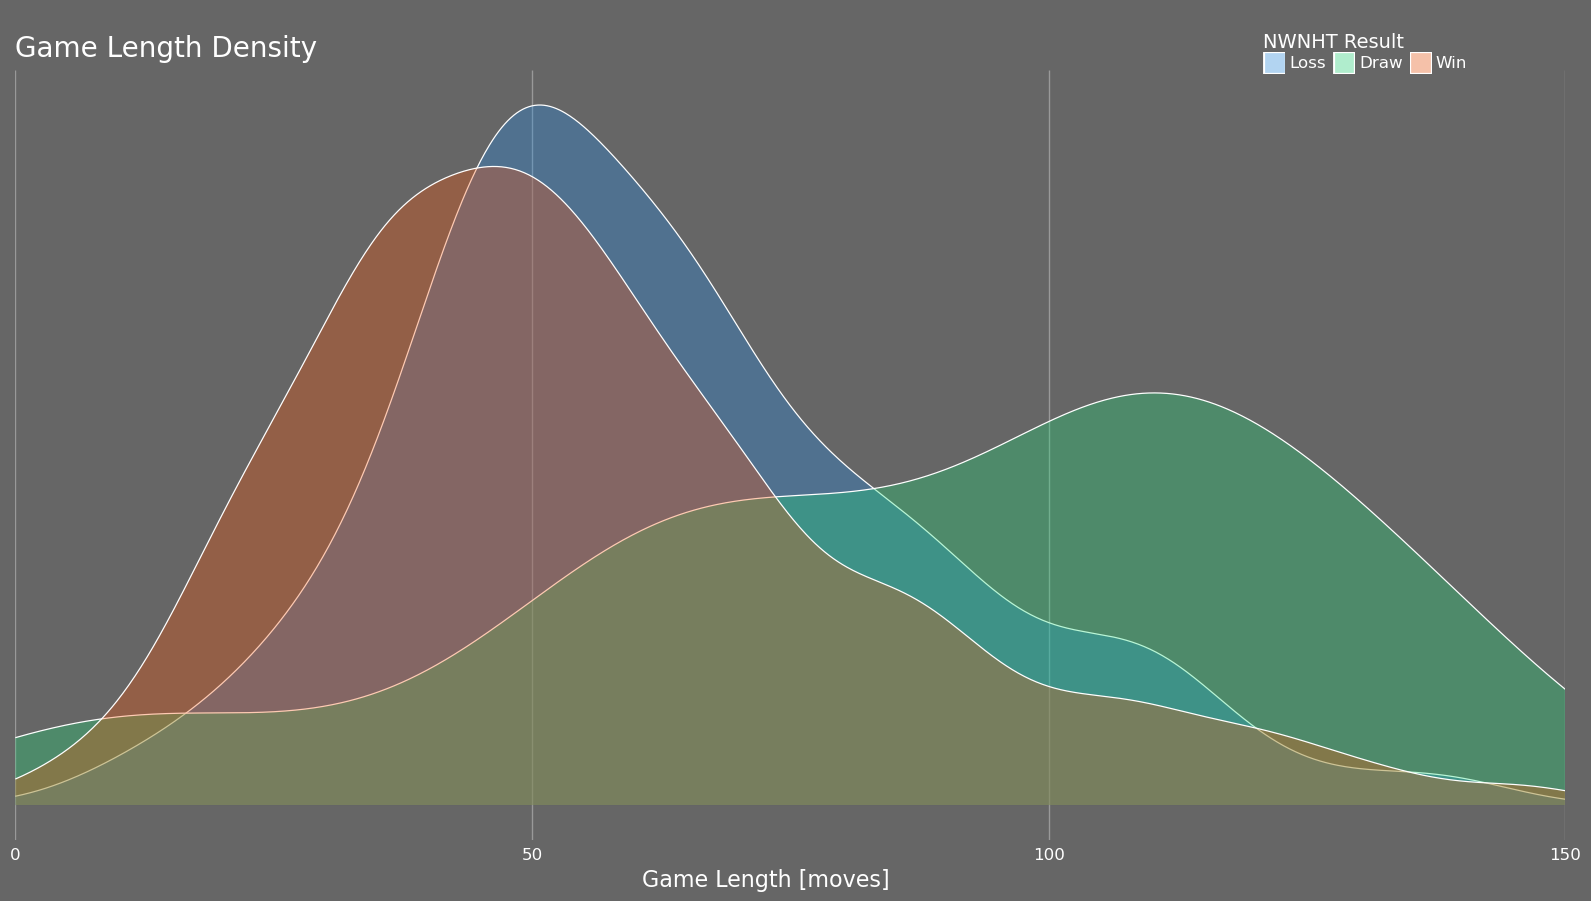
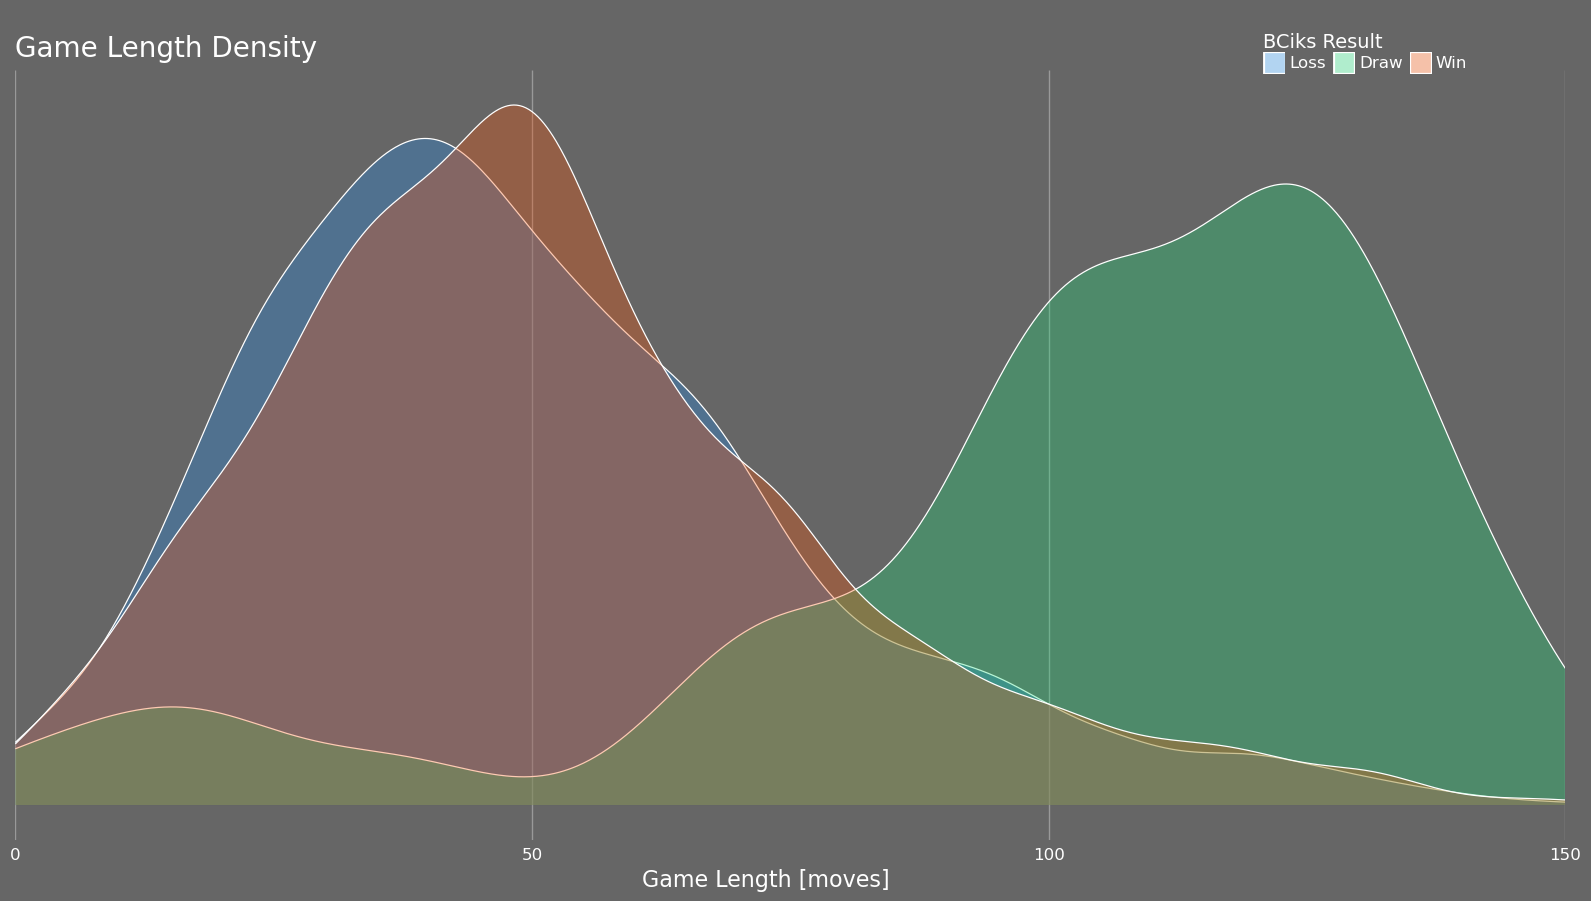
Comparing my game length versus my friend's shows that I draw early in the game far more often than he does. Nearly all of his draws are late in the game while I am clearly more prone to offer draws when I just find the position uncertain. This is also expected as I am quite risk averse and prefer to take a draw over a loss even at the potential cost of a win.
Focusing on the win and loss curves, my wins tend to be shorter games while the opposite is true for my friend. This is expected as I have spent a significant amount of time studying openings and the early moves of the game while my friend has focussed on basic chess principles. I am just surprised that it is so evident in these plots but it is good feedback to know that my studying is having an effect. Furthermore, separately plotting my game length density playing as white vs. black shows that the quick opening wins that I am achieving are primarily with the white pieces while my black openings are average at best.
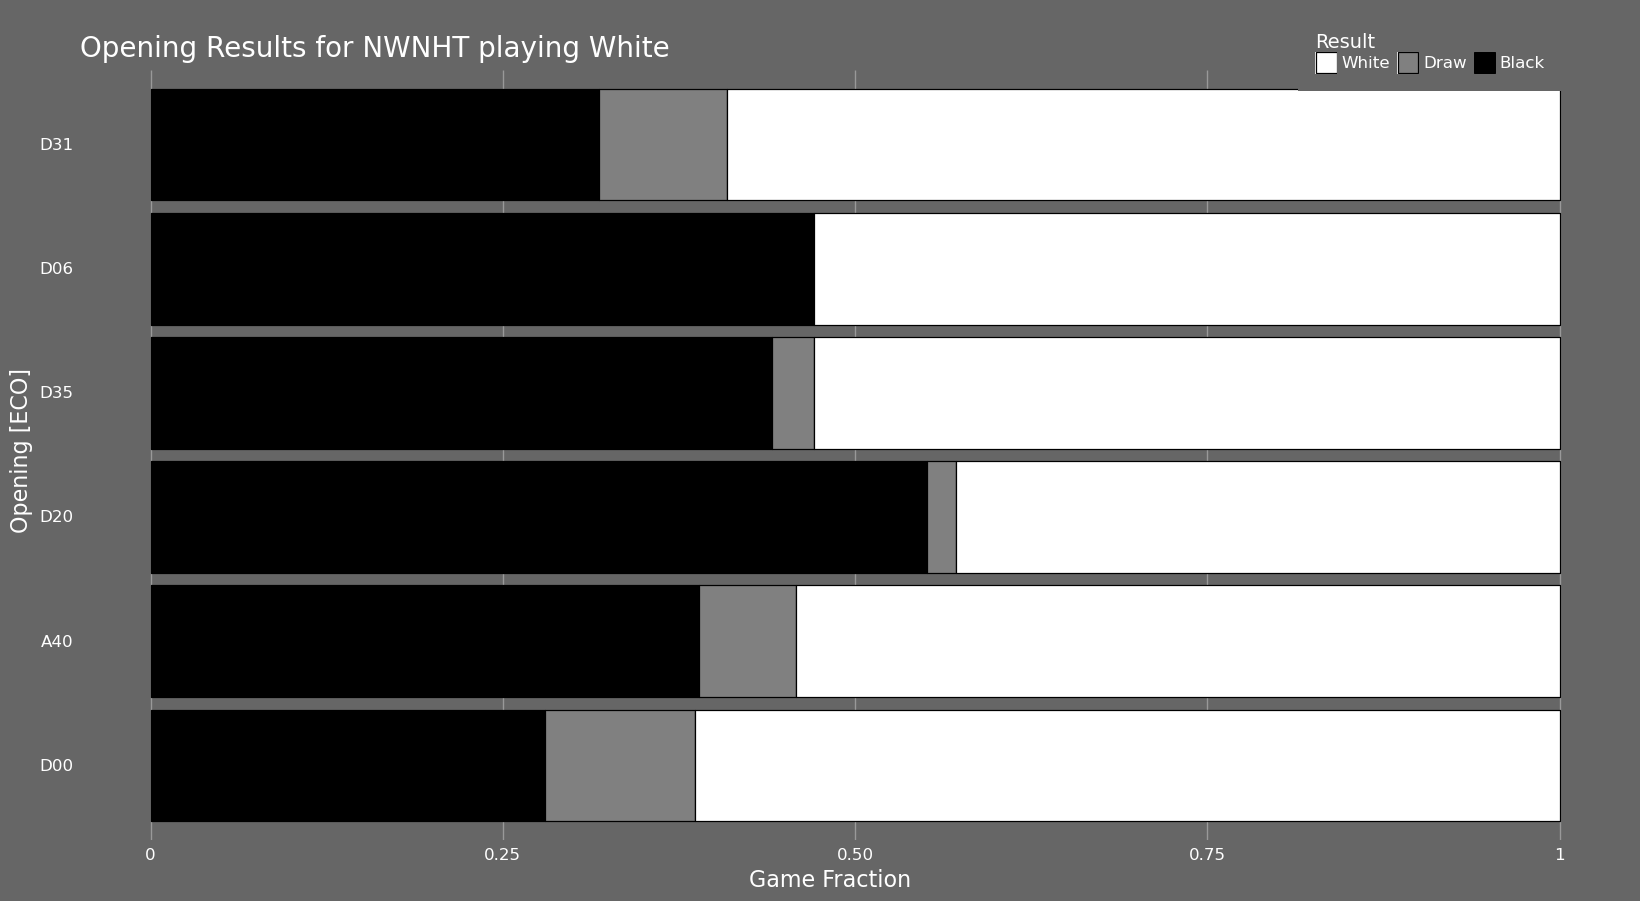
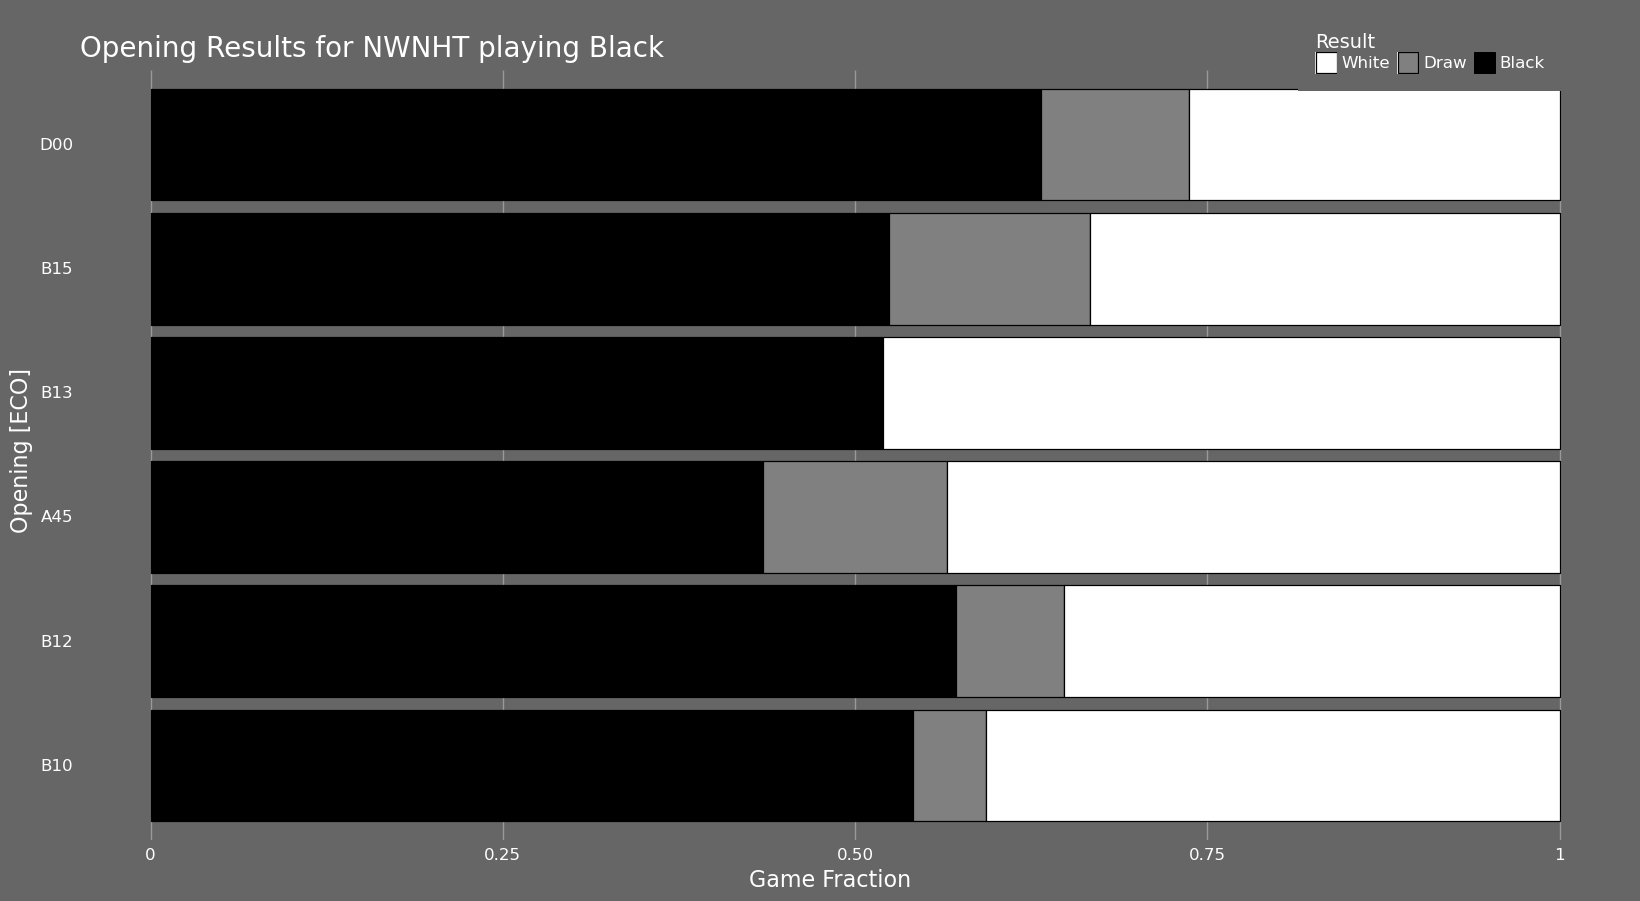
Openings
Speaking of openings, the plot below shows the result proportion of white and black for the 'n' most played openings of a player as dictated by the bottom field of the app. This is most useful when filtering by only black or only white positions but it can be useful with many different combinations of the filters.
In the plot with white openings we can see that the only opening in my top 6 most played with a negative record is ECO D20, the Queen's Gambit Accepted. This is slightly unexpected but I can post-rationalize this now as I admit I haven't studied this line extensively; mostly because it is less common to face than the Queen's Gambit Declined. That touches on something that is lost in this particular plot, the actual magnitude of games played in each opening. This is however shown in the non-fill version of the plot also available in the app.
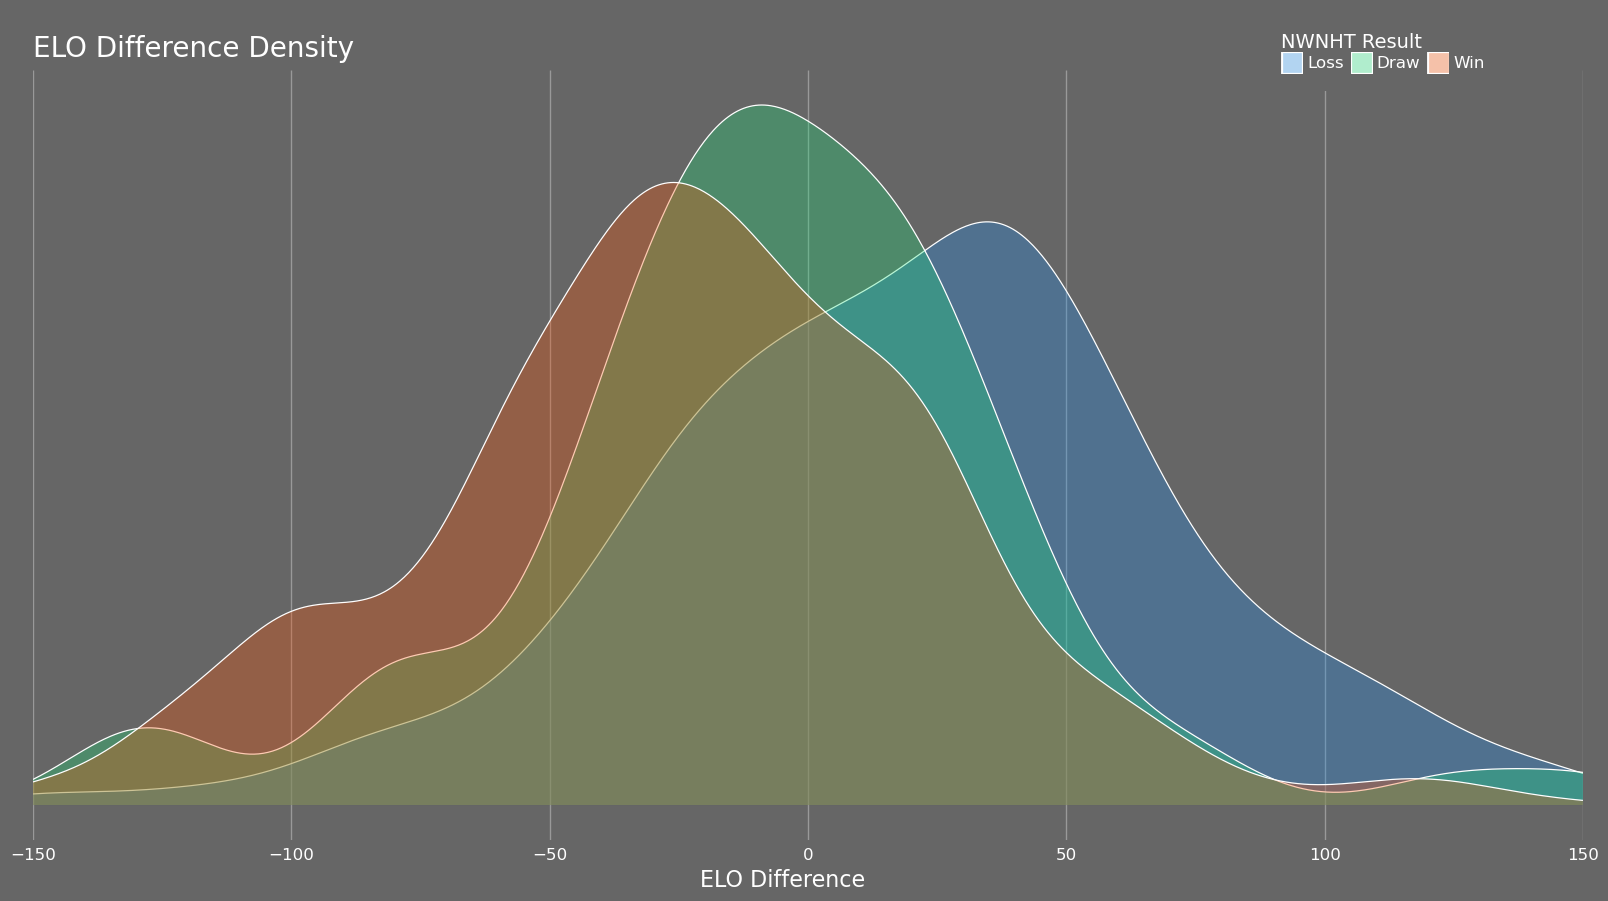
ELO Difference
Another mildly interesting plot is the ELO difference density plot which shows the density of results based on the difference between the player of interest's and their opponent's ELO. The results are incredibly predictable: the higher ELO generally wins and draws tend to be around the same ELO. Isolating for player colour has little effect.
Conclusion / Future Improvements
I really enjoy the app, I can actually see myself using this in the future or generating plots for other people. Additionally there are a few improvements that could be made for usability or just to add some features.
Here are a few possible updates I can think of at the time of writing:
- Include whitelist / blacklist toggle for players and openings
- Implement some type of error messaging
- Currently plot errors just fail quietly
- There could still be some issues with Chess.com data retrieval, will have to monitor
- Add date and/or time range filters
While I was processing the data I also tooled around with using Stockfish to evaluate positions and best moves. It is interesting but I found that the plots and analyses didn't fit in with the rest of the application which focuses on data aggregated over a large number of games.
I plan to delve into Stockfish further but using a relational database to hold the positions and moves independently so that I save the evaluations and avoid running them repeatedly, especially for common opening positions. Even using multiprocessing it can take a while to run a full game evaluation, it would be nice to be able to just import all of the moves/positions into the database and evaluate the positions in batches. We'll see how well this all turns out.