Strava Activity and API
My Fitness Journey if anyone cares?
I played a variety of team sports through grade school and I really enjoyed it. I was never particularly good at any of the sports but my height gave me an advantage in most sports and I was able to capitalize on that. However, there was the great benefit of getting out of class and going to another school for a tournament or game.
When I went to university I knew I wasn't good enough to succeed on any of the university teams so I stopped much of my activity in favour of focussing on academics. I continued to not do any activity until my first work placement in Athabasca, AB where it was so boring that I started running just for something to do. I am no endurance athlete but I reveled in the allure of running faster or further than the day before. After overcoming the initial pains of running I looked forward to each of my morning runs and getting the chance to improve my times. This was abruptly ended when I simultaneously developed knee pain and had to go back to university after my placement.
I didn't do much activity after that but working at a golf course in the summer kept me reasonably active.
Then the pandemic hit and being stuck inside all day drove me to dust off my bicycle. This is where I really hit my stride as it allowed me to chase improvements while doing less damage than running. After a few hundred kilometers on the bicycle I purchased eight year prior I purchased a new bicycle and I have cycled thousands of kilometers in the past few seasons.
I have grabbed a few KOMs and more importantly seen great improvements in my speed and fitness with exception of a couple incidents with a car and some strewn leaves.
Strava
I began recording my workouts with the Apple Fitness App as I just needed a place to record my times and distances. As I got more serious about my times and tracking my progress I switched to Strava for its greater surfacing of statistics as well as the tracking of segments, short 'user created' routes where the best efforts and times are recorded and displayed. I don't focus on segments but it can provide some additional motivation to push for a stretch and try to top the charts.
Strava also offers a subscription service which will further analyze your activities and tell you some stuff about them. However, the more interesting service provided by Strava is their API.
Strava API
The Strava API is actually quite annoying to set up in my experience, it required the assistance of multiple videos and articles from Strava and others to properly configure the permissions and retrieve the authorization token. Thankfully once the correct access token is received you are able to continue using the API with the access and refresh tokens.
The rate limit on the API is alright but not exceedingly generous. It allows 100 calls every 15 minutes with a maximum of 1000 calls a day. This is sufficient for single sessions but many users have hundreds of activities and analysis requiring aggregate data will have to be rationed out to abide by the API limits.
After the confusing setup process the API is well documented and provides a wide variety of endpoints for data of different forms. The most useful for the information I want are /athlete/activities and /activities, providing a paginated list of all activities by an athlete and a detailed view of a specific activity respectively.
Due to the rate limitations of the API(and just for fun), I wrote a caching system for the activity stream requests. I can then limit the number of requests to Strava, especially during development where I am making quite the number of requests. The cache is checked before any request to the Strava API and the API is only called if the activity stream is not found. The cached data is marked with a date but as the activities are extremely static there is currently no expiration mechanism implemented. For edge cases there is an option to force a request to the API and the cache can be cleaned of old activities whenever required.
Plotting with ggplot2/plotnine
I have previously conducted some data analysis in R and I really enjoyed the Tidy Data philosophy/system, especially the ggplot2 package which is built on a grammer of graphics. Luckily, there is a Python port of this package called plotnine. This package uses the grammer of graphics to stack plot elements atop eachother and build the graphic. This provides an easy system to create complex graphics from Pandas dataframes.
The basic construction is a ggplot object specifying the source of the data in a dataframe followed by encodings through aesthetics and geometric objects to show the data. I have previously used this for standard plots as well as visualizing Lego world map patterns.
from pandas import Categorical, DataFrame
import plotnine as gg
from random import randrange

# Create dataframe
dataframe = DataFrame(data = {"column1": list(range(10))
                                 "column2": list(range(10)),
                                 "column3": [0, 1] * 5,
                                 "column4": [randrange(start=0, stop=10) for _ in range(10)]})
dataframe["column3"] = Categorical(dataframe.column3)

# Create plot
plot = gg.ggplot(dataframe, gg.aes(x="column1", y="column2", colour="column3")) \
    + gg.geom_point(size=2) \
    + gg.geom_line(gg.aes(y="column4"), colour="red", size=1.5) \
    + gg.scale_colour_manual(values=["blue", "orange"], guide=False) \
    + gg.theme_light() \
    + gg.theme(figure_size=(10, 5),
               text=gg.element_text(size=12))

print(dataframe)
print(plot)
Output:
   column1  column2 column3  column4
0        0        0       0        6
1        1        1       1        6
2        2        2       0        8
3        3        3       1        2
4        4        4       0        2
5        5        5       1        8
6        6        6       0        0
7        7        7       1        5
8        8        8       0        3
9        9        9       1        6
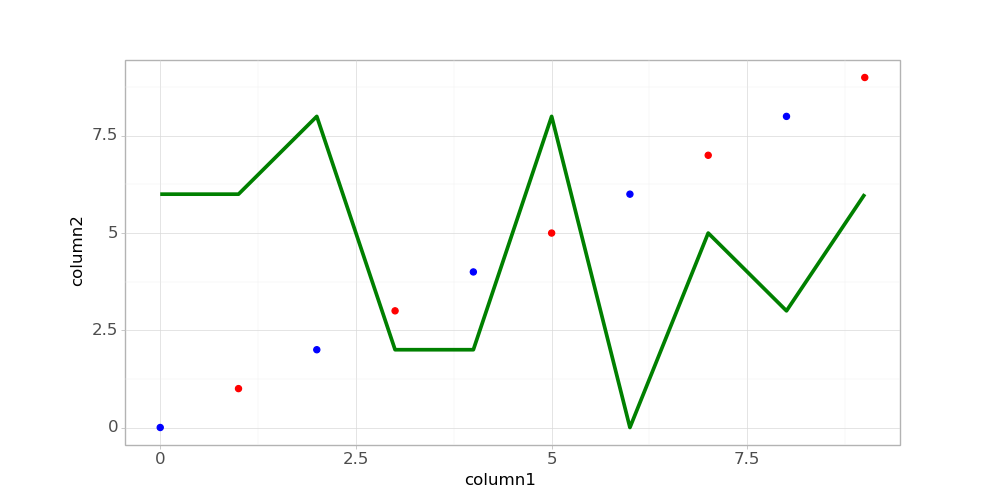
- The above shows the creation of a point and line plot on a single figure. The
ggplot()function takes the dataframe upon which the plot will be based and 'global' aesthetics can be set. - Two geometries,
geom_point()andgeom_line(), are added.geom_line()specifies its own y aesthetic. - The theme is set to a built-in light theme and then theme elements figure_size and text are overwritten with desired values.
- In this case the 'column1' could be excluded as it is identical to the index and the x aesthetic can be set to
dataframe.index.
One of the great things about the grammar of graphics approach is the ability to create sets of elements that can be added to many plots without rewriting it all. I implemented a theme of sorts by creating a PlotTheme class which can be set to light or dark and is applied to all plots.
class PlotTheme:
  def __init__(self, mode=False):
     # True for dark mode, False for light
     self.mode = mode
     self.text = self.background
               = self.velocity
               = self.heartrate
               = self.altitude
               = self.yint
               = self.strip = None
     if mode:
         self.dark()
     else:
         self.light()

  def dark(self):
     self.text = light
     self.background = dark
     self.velocity = "cyan"
     self.heartrate = stred
     self.altitude = "lightgray"
     self.yint = "gray"
     self.strip = "gray"

  def light(self):
     self.text = dark
     self.background = light
     self.velocity = "blue"
     self.heartrate = stred
     self.altitude = "gray"
     self.yint = "gray"
     self.strip = "gray"

  def gg_theme(self):
     return gg.theme_light()
     + gg.theme(text=gg.element_text(color=self.text, size=40),
                axis_title_x=gg.element_text(size=60),
                axis_title_y=gg.element_text(size=60),
                figure_size=(30, 20),
                strip_background=gg.element_rect(fill=self.strip),
                plot_background=gg.element_rect(fill=self.background),
                panel_background=gg.element_rect(fill=self.background),
                panel_grid=gg.element_line(color=self.text),
                panel_grid_minor=gg.element_line(color=self.text))
Continuing from plotnine example:
from strava.plotting.strava_stream_plots

import PlotTheme

pt = PlotTheme()
pt.dark()

print(plot + pt.gg_theme())

Results
The aspects of the Strava data I find most interesting are how my heartrate reacts over a single ride and the evolution of my performance over the few years that I have been cycling. The macro performance can be derived from the /athlete/activities data and the detailed heartrate data can be requested from the /activities data. For these example plots we will be looking at my longest ride to date, a 59km ride on September 18th, 2022.
A sample of the /activities response.
| resource_state | name | distance | moving_time | elapsed_time | total_elevation_gain | type | sport_type | workout_type | id | start_date | start_date_local | timezone | utc_offset | location_city | location_state | location_country | achievement_count | kudos_count | comment_count | athlete_count | photo_count | trainer | commute | manual | private | visibility | flagged | gear_id | start_latlng | end_latlng | average_speed | max_speed | has_heartrate | average_heartrate | max_heartrate | heartrate_opt_out | display_hide_heartrate_option | elev_high | elev_low | upload_id | upload_id_str | external_id | from_accepted_tag | pr_count | total_photo_count | has_kudoed | athlete.id | athlete.resource_state | map.id | map.summary_polyline | map.resource_state |
|---|---|---|---|---|---|---|---|---|---|---|---|---|---|---|---|---|---|---|---|---|---|---|---|---|---|---|---|---|---|---|---|---|---|---|---|---|---|---|---|---|---|---|---|---|---|---|---|---|---|---|---|
| 2 | Afternoon Ride | 42820.4 | 5501 | 5786 | 267.7 | Ride | Ride | nan | 7928110779 | 2022-10-07T19:44:16Z | 2022-10-07T13:44:16Z | (GMT-07:00) America/Edmonton | -21600.0 | None | None | None | 2 | 0 | 0 | 1 | 0 | False | False | False | False | everyone | False | b7151693 | [45.50966551898074, -73.52792169310909] | [45.50966551898074, -73.52792169310909] | 7.784 | 14.578 | True | 171.5 | 192.0 | False | True | 694.2 | 650.1 | 8476205946.0 | 8476205946 | D0D89D9C-E187-4BD3-B9B9-A3B2F285D7B7-activity.fit | False | 0 | 0 | False | 56778178 | 1 | a7928110779 | Polyline removed for brevity | 2 |
| 2 | Morning Ride | 15448.7 | 2053 | 2073 | 78.0 | Ride | Ride | nan | 7916199658 | 2022-10-05T16:02:59Z | 2022-10-05T10:02:59Z | (GMT-07:00) America/Edmonton | -21600.0 | None | None | None | 0 | 0 | 0 | 1 | 0 | False | False | False | False | everyone | False | b7151693 | [37.23086745943844, -8.630392914231805] | [37.23086745943844, -8.630392914231805] | 7.525 | 15.918 | True | 165.2 | 184.0 | False | True | 694.2 | 652.7 | 8462743743.0 | 8462743743 | 9F8E1E2E-9E72-4AA7-835B-5DEAB0819004-activity.fit | False | 0 | 0 | False | 56778178 | 1 | a7916199658 | Polyline removed for brevity | 2 |
| 2 | Afternoon Ride | 36290.3 | 4682 | 4860 | 173.7 | Ride | Ride | nan | 7912211536 | 2022-10-04T19:24:22Z | 2022-10-04T13:24:22Z | (GMT-07:00) America/Edmonton | -21600.0 | None | None | None | 1 | 0 | 0 | 1 | 0 | False | False | False | False | everyone | False | b7151693 | [52.38876040406538, 4.5406777344509335] | [52.38876040406538, 4.5406777344509335] | 7.751 | 13.028 | True | 163.1 | 183.0 | False | True | 694.2 | 652.7 | 8458270931.0 | 8458270931 | 100A2072-C195-4872-9F8B-B2A9EAB4F479-activity.fit | False | 0 | 0 | False | 56778178 | 1 | a7912211536 | Polyline removed for brevity | 2 |
A sample of the /athlete/activities response.
| moving | velocity_smooth | distance | altitude | heartrate | time |
|---|---|---|---|---|---|
| False | 0.000 | 3.7 | 692.2 | 122 | 0 |
| True | 1.132 | 6.0 | 693.6 | 122 | 2 |
| True | 1.509 | 8.2 | 693.7 | 122 | 3 |
Streams
The Strava API allows you to request a number of streams from an activity so I took the heartrate, velocity, and altitude. These are normalized and combined to produce the summary plot below. Altitude in gray, velocity in cyan and heartrate in Strava orange/red.

The plots below show heartrate and velocity data separately, with altitude for reference.


The raw data produced from the rides is quite difficult to read due to the inaccuracy of the Apple Watch GPS as well as the natural high variance in speed during my ride as I slow for people or sharp corners. For this reason I have applied a rolling average of various width to the altitude, heartrate, and velocity datasets. This results in a more pleasant visual but comes with the downside of dulling the peaks and valleys.
The distribution of the raw speed data can be seen in the histogram below. The highest reading exceeds 65km/h but reviewing the distribution it is likely I only achieved speeds up to 50km/h and only for brief periods. For this reason I believe that the rolling average actually provides a more accurate view.

Beyond just displaying the heartrate and velocity streams, I saw that Strava offers analysis of heartrate zones. These are heartrate ranges relative to your maximum heartrate and have become a common way to categorize effort and intensity of workouts. The figure below shows my heartrate in a line as well as the heartrate zone represented by the background colour.

To anyone familiar with heartrate zones it should be clear that I don't put much consideration on them while exercising. Either I am pushing too hard for too long, or I have underestimated my maximum heartrate.
I have also made a simple figure to represent the proportion of time that I am in each heartrate zone.

Summary
As previously mentioned, I also retrieved the summary data for all of my activities. These plots may not look as cool but likely provide more insight into preformance improvements. As shown in the example data above, the activity summaries provide distance, elevation, heartrate, and speed per ride so I decided to plot them all.
Below are the plots and some notes about each of them.
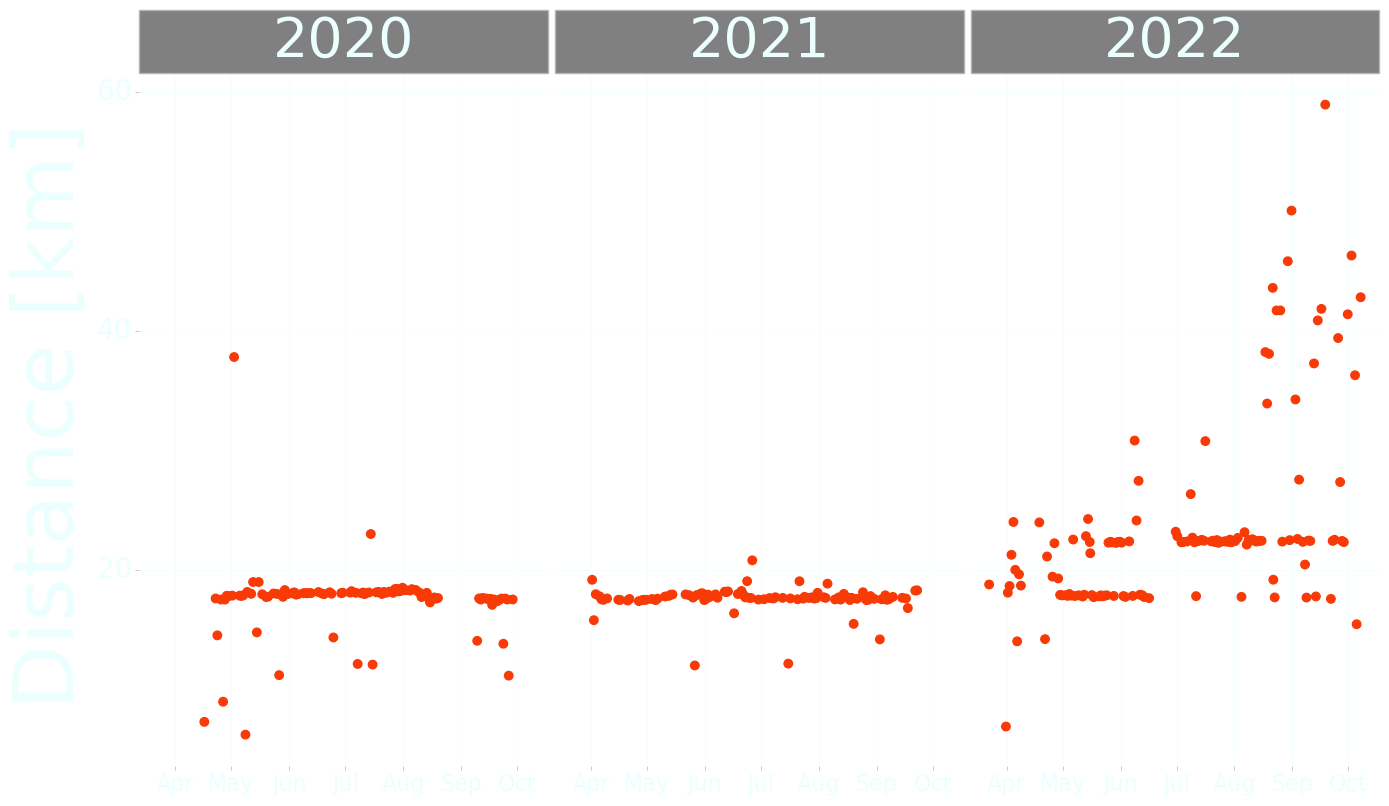

- The distance and altitude plots above are nearly equivalent as could be expected.
- For the first two and a half seasons I only rode a single route with few exceptions.
- I found a route I enjoyed and this made it very easy to compare times.
- In retrospect I am actually impressed by how many times I took exactly the same route. Though it does give comparisons of other metrics across this time span more validity as this holds a lot of variables constant.
- Mid-way through 2022 I was inspired to extend my regular route by a few kilometers and began to go on increasingly longer rides.

- This is one of my favourite plots, showing the steady progression in speed through the seasons and across years. It is also remarkably consistent(?), I only removed two exceptionally anomalous activities from the plots.
- At the beginning of 2020 I had an average speed of approximately 22km/h and at the end of 2022 I am now averaging 28km/h.
- This speed increase may be slightly inflated by the fact that the additional distance has mostly been on roads with high speeds but the speed increase is also present when comparing similar routes.
- The influence of the longer rides can also be seen in the increase in maximum speed.

- This plot shows the same progression as the speed plot but inverted.
- This is likely a better indicator of my fitness as my speed on the trails is predominantly limited by other people on the trail and the trail itself.
- It is quite evident that I do little activity during the off-season as I lose whatever fitness I gained over the summer.
- Note that the average velocity was equivalent or greater in the later activities so the decrease in average heartrate is likely due to an increase in fitness and not a lesser effort.
Code
All of the code used in the creation of these plots has been stored in a Github repository. It is not particularly pretty or well documented but if you are able to sort out the authorization token and store it in the .config directory then it should all work out.
Integration to Website
I enjoy looking at these plots but it is a bit out of the way to generate them after each ride. Additionally, I would like them to be available on my website but as it is hosted as a github page there are further complications. Every time that I want to update the images I would have to make a fresh commit and push. Alternatively I can separately host and update the images somewhere else. I have explored hosting the images from my Google Drive as I have some previous experience with that but Google's Drive API requires reauthentication once every seven days for unpublished applications. This is a frustrating limitation to say the least.
I also explored the possibility of generating and hosting the plots on a RPi but then I have to worry about my non-static IP address and uptime of the device. I don't think that this is a great solution either.
At the time of writing this article I am still hosting them on Google Drive requiring manual updates. This is unfortunate but I'm sure I will find a better solution at some point. I suspect that I will have to sort out some other hosting solution if I wish to solve this problem effectively.